-
SEARCH
Type your search in the field above

Potential, negative and positive effects on the economy, environment and people
Climate change refers to the long term changes in the Earth’s climate system, including, changes in temperature, precipitation, and weather patterns, that are primarily caused by human activity.
Climate changes can cause several negative impacts such as:
Rising sea levels: As global temperature rise, glaciers and ice sheets melt, and sea levels rise. This could lead to flooding of low-lying areas and displacement of millions of people.
Extreme weather events: Climate change leads to more frequent and severe weather events, including hurricanes, droughts, heatwaves, and wildfires. These events can cause significant damage to infrastructure, homes, and ecosystems.
Loss of biodiversity: As temperatures rise, many species may be unable to adapt to changing conditions and may go extinct. This could have cascading effects on ecosystem and food chains.
Water scarcity: Climate change is expected to lead to more frequent and severe droughts, which could lead to water scarcity in many regions. This can potentially cause conflicts over water resources and harm agriculture and food production.
Health impacts: Climate change could lead to increased incidence of several diseases. This could have significant impacts on public health and healthcare systems.
Economic impacts: Climate change could lead to significant economic impacts, including damage to infrastructure, lost productivity, and higher costs for disaster relief. These impacts could be particularly severe for low-income communities and developing countries.
In its Global Climate Highlights 2023 Copernicus (the Earth observation component of the European Union’s Space program) concluded that 2023 has replaced 2016 as the warmest calendar year on record (records going back to 1850). Extreme weather events (such as flooding, wildfires, drought and extreme heat) in the world in 2023 had significant impacts on human health, ecosystem and infrastructure. The atmospheric concentrations of carbon dioxide and methane continued to increase and reached record levels in 2023. There is a great chance that 2024 will be warmer than 2023. The urgency to take decisive climate action has never been greater.
Lerøy, is aware of its duty to contribute to taking climate action by reducing its emissions of carbon dioxide and other greenhouse gases (GHG).
The organization emits GHG through its operations. Lerøy is performing GHG reporting (Scope 1, 2 and 3) to monitor and control its own and relevant supply chain emissions in order to be able to take appropriate measures for reducing the organization’s GHG emissions.
The organization also implicitly contributes to deforestation by purchasing fish feed. Lerøy is working proactively with its business partners (including fish feed suppliers) to develop alternative fish feed ingredients. In 2023 Lerøy entered a strategic partnership agreement with a fish feed supplier. A strategic partnership agreement ensures that we collaborate with a partner that has an ambition to be deforestation free by 2025.
Lerøy generates waste, including plastic waste, however it is taking appropriate steps to reduce its contribution to waste pollution (for more detailed information regarding waste pollution, please, visit section Water and Waste Management (Environment) in Lerøy Sustainability library 2023.
Lerøy has developed Climate and Energy Consumption Policy which sets out a range of actions and measures aimed at addressing climate change and introducing sustainable business practices. The goal of the policy is to mitigate the negative impacts of climate change and reduce risks associated with it.
Actions taken to manage the topic and related impacts:
Lerøy is continuously working on improving its monitoring and reporting of greenhouse gas emissions. Information regarding our greenhouse gas emissions is crucial for understanding and responding to environmental challenges as well as to being able to identify improvement opportunities.
In 2023 the Company continued to which aimed to enhance Lerøy’s reporting processes and practices. The Group has strengthened its reporting routines; however, we acknowledge that we need to focus on further improvement of quality of the reported data to ensure that the reporting is more accurate, complete and transparent.
A key change which was introduced in 2022 was that a major part of well-boat and service boat activity (time chartered vessels) was moved from Scope 3 to Scope 1 reporting including operating leases (as defined by IFRS 16) in Scope 1 accounting (for more detailed information regarding operating leases, please, visit https://www.ifrs.org/). This change has had a significant effect on Scope 1 reporting results - substantial increase of Scope 1 emissions compared to levels. Emissions from well-boats and service boats represent approximately 22% of total Scope 1 emissions in 2023. During 2023 Lerøy continued to facilitate closer cooperation with shipping companies that provide well-boat and service boat services and has worked on enabling the shipping companies to improve their procedures for gathering and reporting of relevant data as well as on strengthening reporting processes internally.
The Group’s Scope 1, 2 and 3 GHG emissions in 2023 have decreased with 1,48% (18 033,9 tCO2e) compared to 2022 levels.
Scope 1 have decreased with 1,09% compared with 2022 levels.
Scope 2 emissions have increased with 8,8%.
Scope 3 emissions have decreased with 1,63%.
The Group does not produce a significant amount of ODS and therefore does not report production of ODS.
NOx (Nitrogen Oxides) and SO2 (Sulphur Dioxid) Calculations
In 2023 Lerøy has emitted 1283,81 tonnes NOx and 44,09 tonnes SO2 (Sulphur Dioxid). The basis for calculating the numbers is our Scope 1 reporting.
The organization does not have significant emissions of persistent organic pollutants (POP), volatile organic compounds (VOC), hazardous air pollutants (HAP), particulate matter (PM) or other categories of air emissions.
Data source and method: Statistics Norway (2022)
Science Based Targets
Lerøy has set ambitious science based targets to reduce our carbon footprint: We aim to reduce our CO2e emissions by 46% by 2030 compared to 2019 levels. (ref: Climate Policy). Lerøy has defined 2019 as the base year for our science-based climate target as this was the first year all operating segments in the Group were conducting greenhouse gas emission reporting for Scope 1, 2 and 3. Lerøy has reduced its overall Scope 1, 2 and 3 emissions with 15,46% from 2019 levels.
Lerøy has also committed to become climate neutral by 2050.
The Group is in the process of evaluating changing its Science Based Target base year. The organization needs to go through a thorough assessment, evaluate pros and cons for either keeping or changing the base year.
The Group’s operating segments are the following:
The reported emission figures have been collected throughout 2023 from relevant suppliers via invoices and are based on the same data sources as the figures reported in Lerøy’s 2022 annual report.
Lerøy’s GHG emissions are reported in accordance with the GHG Protocol Corporate Accounting and Reporting Standard. The Group uses operational control approach for consolidating its GHG emissions accounting. It means that emissions from operations, over which Lerøy have operational control, are included in Scope 1 and 2 reporting. Indirect upstream and downstream emissions relating to its operations are accounted for in Scope 3. Reporting units account for their use of fossil fuels, refrigerants, electricity, district heating/cooling, water usage, waste composition (incl. methods of waste disposal). Climate account statements are consolidated in the same manner as financial statements showing aggregated results for the Group’s entities (reporting units).
The Group’s Scope 3 emissions are reported in accordance with the GHG Protocol Corporate Accounting and Reporting Standard (Corporate Value Chain (Scope 3)). The Group has mapped its “carbon hotspots” and identified the main sources of greenhouse gas emissions which are included in the Group’s Scope 3 climate accounts. For more detailed information, please, see table Scope 3 Overview per Category below.
Emission factors
Emissions data for Scopes 1, 2 and 3 cover reporting of the following greenhouse gases: carbon dioxide (CO2), methane (CH4), nitrous oxide (N2O), hydrofluorocarbons (HFCs), perfluorocarbons (PFCs) and HFO (hydrofluro-olefins). There are seven main GHGs that contribute to climate change, as covered by the Kyoto Protocol: carbon dioxide (CO2), methane (CH4), nitrous oxide (N2O), hydrofluorocarbons (HFCs), perfluorocarbons (PFCs), sulphur hexafluoride (SF6) and nitrogen trifluoride (NF3).
The Group has had 1290 tCO2e biogenic CO2 emissions in Scope 1 and 304 tCO2e in Scope 3 in 2023.
Biogenic emissions are CO2 emissions related to the natural carbon cycle, as well as those resulting from the combustion, harvest, digestion, fermentation, decomposition, or processing of biologically based materials.
Scope 1
Sources for Scope 1 emission factors used for calculation of tCO2e are DEFRA (Department for Environmental Food and Rural Affairs, UK Government), 2023, The Norwegian Environment Agency 2023 as well as National standard factors 2015 24th February, A-gas product information guide, Honywell Solstice N40 Product sheet, 2014.
Scope 2
There are two types of Scope 2 emissions: location-based, and market based. Location-based Scope 2 emissions are calculated based on the average emissions factor for the grid region where the organization consumes electricity. Marked-based Scope 2 emissions, on the other hand, take into account the specific contractual instruments that an organization has in place to purchase renewable energy certificates or power purchase agreements.
Nordic Electricity Mix 2023: Location-based emission factor
Calculation of the emission factor Electricity Nordic Mix Location-based emission factor for 2023 shows a slight increase from 2022. The factor used for 2023 accounting is 28 gco2/kwh which corresponds to an increase of 8% from 2022 (26 gco2/kwh). To calculate the factor, statistics from IEA (International Energy Agency/OECD were used. Every year, the IEA calculates national emission factors for all countries based on physical production statistics (location-based method), which are again based on statistics obtained from national system operators and statistics authorities. The Nordic average factor is calculated as a weighted average of the Swedish, Finnish and Danish emission factor. The factors for 2023 are based on official statistics from 2021. The national factors are weighted with the electricity production in each individual country, i.e. gross electricity production. The distribution loss is not included in the factor (this must be reported as Scope 3 emissions according to GHG protocol
Electricity Nordic Mix 2023: Market-based emission factor
The emission value used for untracked electricity (residual mix EF) when reporting using the factor “Electricity Nordic Mix” is calculated by taking a weighted average of the national residual mix enission factors for the 4 included Nordic countries (Norway, Denmark, Sweden, Finland). The national residual mix emission factors are sourced from the report “European Residual Mixes 2022” (AIB, 2023), and are based on data for 2022. In 2023, the market-based emission factor is 328 kgCO2e/kWh.
For consistency with the location-based calculation, which is based on emissions data from IEA for the same 4 Nordic countries for 2021 (last available full year), the same weighting percentages are used in the calculation of the market-based figure. These percentages are based on each country’s share of the national electricity generation for all 4 countries during 2021.
Emission factors for electricity and heat generation for France, Italy, Portugal, Spain and the Netherlands
Source of emission factors related to emissions from electricity and heat generation (for both location and market based emissions) for France, Italy, Portugal, Spain, the Netherlands is IEA Emission Factors database (2023), AIB (2023), European Residual Mixes 2023, Energy Stattistics Data Browser.
Emission factors for electricity and heat generation for Turkey
IEA Emission Factors database (2023), there is no residual mix EF available, location-based EF applied in market based calculation, IEA (2023), World Energy Balances (database).
Emission factors for electricity and heat generation for the USA
IEA Emission Factors database (2023), 2023 Green-e Residual Mix Emission Rates (2021 data), IEA (2023), World Energy Balances (database).
Guarantees of Origin (GOs)
The Group has purchased Guarantees of Origin (GOs) in 2023 Information regarding companies which have purchased GOs as well as the percentage share that covers the consumption is reported in Cemasys (the Group’s internal reporting system for GHG emissions accounting).
Regarding market-based emissions – the choice of emission factor using this method is determined by whether the business acquires Guarantees of Origin or not. For electricity without the GOs, the emission factor is based on the remaining electricity production after all GOs for renewable energy are sold. This is residual mix, which is normally substantially higher than the location-based factor.
Scope 3
Sources for Scope 3 emission factors used for calculation of tCO2e are DEFRA (Department for Environmental Food and Rural Affairs, UK Government) 2023, International Energy Agency (IEA) 2023 Emission factors Greenhouse gas emissions of Norwegian seafood products in 2017, SINTEF study, Emission factors from fish feed producers 2023, Database Ecoinvent 3.8; 3.9; 3.9.1; 3.10 as well as supplier specific emission factors.
Info: Expand table for more details
| Category | tCO2e | |
|---|---|---|
Purchased goods and services
|
||
Capital goods
N/A |
||
Fuel and energy related activities
Well to Tank (WTT)**. Calculations based on the existing consumption data volumes collected from the Group’s companies throughout the year. The calculation is based on the reported consumption data for Scope 1 and 2 (for more detailed information, see table Total Consumption of Fossil Fuels (Scope 1). |
||
Upstream transportation and distribution (outbound transportation)
Transportation services (sea transportation, service boats, well boats***). Consumption data collected from sea transportation/ well- boat service providers (calculations include WTT). Transportation of produced products to customers. Information collected from the Group’s Logistics department. The calculations are based on distance from capital to capital. The emission factors used are determined by type of transportation mode. |
||
Waste generated in operations
Waste - data on waste volumes, waste composition (incl. methods of waste disposal) is collected from the Group’s companies throughout the year. |
||
Business travel
Air travel (business travel by air) - information regarding distances traveled is collected from travel agent the Group uses (including WTT). |
||
Employee commuting
Employee commuting – estimation based on SSB (Statistisk Sentralbyrå) for Norwegian operations, TRAFA (Transport Analysis) for Swedish operations, and STATISTA for operations in the Netherlands. For all other operations - INSEE statistics, ACEA (European Automobile Manufacturer’s Association) well as official government websites are used. NB! The main difference between the methodology used in 2022 and 2023 is that in 2023 we have chosen to report the number of kilometers divided by various transport methods for commuting per country in 2023. The level of detail for the methodology used for 2023 gives a more realistic picture of the employee commuting emissions per country. We have made an assumption that the distribution is 25% between four selected transport categories (tram, bus, subway and train). |
||
Upstream leased assets
N/A |
||
Downstream transportation and distribution
Downstream transportation and distribution - transportation of products carried out by the customers themselves. Information collected from the Group’s Logistics department. The calculations are based on distance from capital to capital. The emission factors used are determined by the mode of transportation. |
||
Processing of sold products
Processing of sold products – calculations consist of two parts – part one - estimated use of electricity for storage of fish in the country of consumption before the product is sold to end consumer. Part two – estimated emissions related to third party processing. |
||
Use of sold products
N/A |
||
End-of-life treatment of sold products
End of life treatment – organic waste estimated share (%) of non-edible fish. |
||
Downstream leased assets
N/A |
||
Franchises
N/A |
||
Investments
N/A |
||
*For more detailed information regarding the categories, please visit Corporate Value Chain (Scope 3) Accounting standard
**A Well-to-Tank emissions factor, also known as upstream or indirect emissions, is an average of all the GHG emissions released into the atmosphere from the production, processing and delivery of a fuel or energy vector.
*** Well-boats and service boats which are not classified as operating leases (ref. definition IFRS 16) are included in Scope 3 emissions since Lerøy does not have operational control over the leased assets held under an operating lease.
NB! Scope 3 emissions are not included in the GHG emissions intensity ratio calculation, however Scope 3 is a significant contributor to GHG emission intensity. The Group is working on improving its reporting routines to be able to allocate Scope 3 emissions to the respective segments in the Group.
| Unit | 2019 | 2020 | 2021 | 2022 | 2023 | |||||||||||||||||||||||||
|---|---|---|---|---|---|---|---|---|---|---|---|---|---|---|---|---|---|---|---|---|---|---|---|---|---|---|---|---|---|---|
Group
|
||||||||||||||||||||||||||||||
| Unit | 2019 | 2020 | 2021 | 2022 | 2023 | ||||||||||||||||||||||
|---|---|---|---|---|---|---|---|---|---|---|---|---|---|---|---|---|---|---|---|---|---|---|---|---|---|---|---|
Farming
|
|||||||||||||||||||||||||||
Wildcatch
|
|||||||||||||||||||||||||||
VAP, Sales & Distribution
|
|||||||||||||||||||||||||||
Group
|
|||||||||||||||||||||||||||
Annual Scope 2 Market-based GHG emissions:
|
|||||||||||||||||||||||||||
TOTAL CONSUMPTION OF FOSSIL FUELS AND REFRIGERANTS (SCOPE 1)
| Unit | 2021 | 2022 | 2023 | |
| Farming | ||||
| Diesel1 | liter | 2 893 492 | 6 264 465 | 6 353 276 |
| Marine Gas Oil (MGO)2 | liter | 3 461 428 | 12 994 859 | 13 352 186 |
| Petrol3 | liter | 471 823 | 558 852 | 546 494 |
| Fuel oil | liter | 45 916 | 661 | - |
| Refrigerants4 | kg | 379 | 140 | 454 |
| Wildcatch | ||||
| Diesel1 | liter | 10 789 | 7 927 | 23 785,4 |
| Marine Gas Oil (MGO)2 | liter | 43 309 534 | 40 341 435 | 40 057 005 |
| LPG (Propane) | kg | 2 013 | 704 | 463 |
| Petrol3 | kg | 486 | 169 | 26 |
| Refrigerants4 | kg | - | 677 | 2 355 |
| VAP, Sales & Distribution | ||||
| Diesel1 | liter | 476 053 | 600 168 | 594 540 |
| Petrol3 | liter | 44 521 | 107 091 | 91 287 |
| Natural gas | m3 | 189 628 | 478 537 | 260 043 |
| LPG (Propane) | kg | 36 588 | 79 842 | 99 808 |
| Fuel oil | liter | 21 795 | - | - |
| Refrigerants4 | kg | 1 680 | 5 578 | 809 |
| Group | ||||
| Diesel1 | liter | 3 380 334 | 6 872 560 | 6 971 601 |
| Marine Gas Oil (MGO)2 | liter | 46 770 962 | 53 336 294 | 53 409 191 |
| Petrol3 | liter | 516 830 | 666 111 | 637 807 |
| Natural gas | m3 | 189 628 | 478 537 | 260 043 |
| LPG (Propane) | kg | 38 601 | 80 546 | 100 271 |
| Fuel oil | liter | 67 711 | 661 | - |
| Refrigerants4 | kg | 2 059 | 6 395 | 3 618 |
1) Diesel includes Diesel (100% fossil), Diesel with added second-generation biofuels (avg. 6% FAME/HVO), Diesel (B7), Diesel (B10) and Diesel (B30 HVO)
2) MGO includes 100% fossil MGO and MGO with added second-generation biofuels (avg. 6% FAME/HVO)
3) Petrol includes Petrol (100% fossil), Petrol (E5), Petrol (E10)
4) Refrigerants include R-404 A, R-407 A, R-448 A, R-452 A, R-507 A and R-717 (Ammonia)
Sustainable development is based on three fundamental pillars:
Environment - We must take care of the environment. All activity affects the environment, but we must ensure that the environment will return to its original state after use in order to be able to operate in an eternal perspective.
Social - we must look after the people and the local environment. Ensure that human rights are safeguarded for employees who are involved directly or indirectly in our value chain and contribute positively to the local environment around us.
Governance – We must comply with laws and regulations, protect our reputation and operate profitably.

We will reduce our greenhouse gas emissions by 46% by 2030. Lerøy has an ambition to be climate neutral by 2050.
In order to reach our greenhouse gas emission reduction target, we have initiated 3 main projects that will contribute to reduction of greenhouse gas emissions in Lerøy. These projects are targeting our most significat greenhouse gas emissions sources.
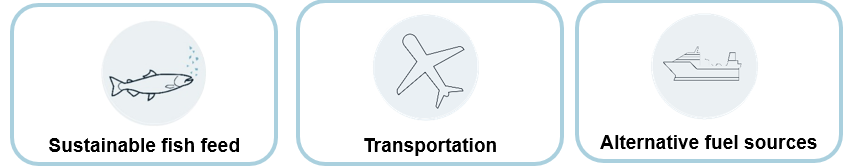
Raw materials for fish feed have been proven to contribute the highest greenhouse gas emissions. It constitutes a large part of Lerøy's Scope 3 category "Purchased goods and services" (478 685 tCO2e in 2023). Lerøy therefore wants to prioritize raw materials that contribute to reaching our grennhouse gas emissions reduction target without compromising biodiversity and other important ESG aspects.
Improving and upscaling production of novel feed ingredients for agriculture and aquaculture can reduce climate gas emissions. Kelp has traditionally been used as feed for livestock in coastal areas and is currently used for producing feed ingredients. There is a significant potential for increasing the production, and Lerøy´s and Bellona´s Ocean Forest initiative is an important contribution.
To become climate neutral (international, national, and company ambition), it will not be enough to reduce emissions of climate gases. It will also be necessary to implement measures to capture carbon. More production of kelp could give a significant contribution.
The company has initiated these innovative projects to reduce GHG emissions:
Upstream transportation and distribution is our second largest greenhouse emisson source, and resulted in 421 293 tCO2e in 2023. Transportation of produced products to customers is the largest contributar, prioritization of optimalization of transport weight and develop technology to be able to choose more environment friendly transportation is crucial.
Leroy is participating in different innovation programs on how to create alternatives for fossile fules like MGO.
Our total Scope 1 emissions in 2023 was 168 064 tco2e. In the Wildcatch segment Lerøy Havfisk is a part of an innovation program exploring how to use green ammonia to reduce the dependency of MGO, in addidtion the Farming segment which has electrified a large proportion of its of farm locations.
Electrification of fleets, well boats and workboats
The world's largest shore current system for well boats is ready for use at Hitra. This investment is one of many measures we are taking to achieve the company's goal of reducing greenhouse gas emissions by 46% by 2030. Our goal is to create the world's most efficient and sustainable value chain for seafood, says Harald Larssen, general manager of Lerøy Midt.
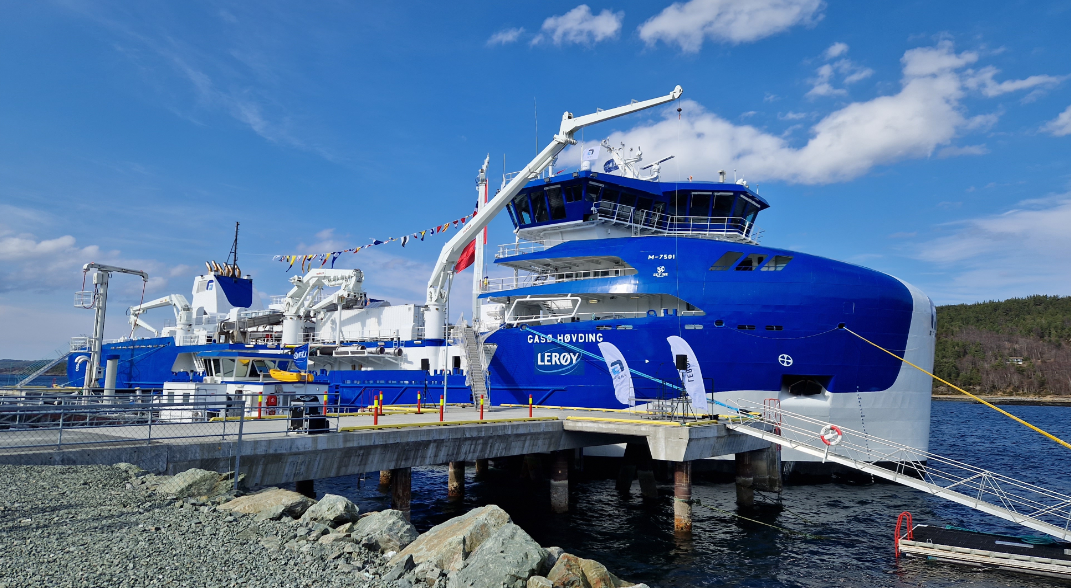
Lerøy Midt has chartered the wellboat Gåsø Høvding, which has been built to run all systems on board completely electrically for direct delivery of salmon to our slaughterhouse on Jøsnøya in Hitra. The well boat is the world's largest with more than double well volume comparing to normal well boats. The well boat is owned by Frøy Rederi AS, which has invested large sums in the system for electric operation.
With the investment in the high-voltage shore power plant, Lerøy Midt has the potential to significantly reduce nitrogen oxide (NOx) emissions and emissions of several thousand tonnes of CO2 equivalents annually.
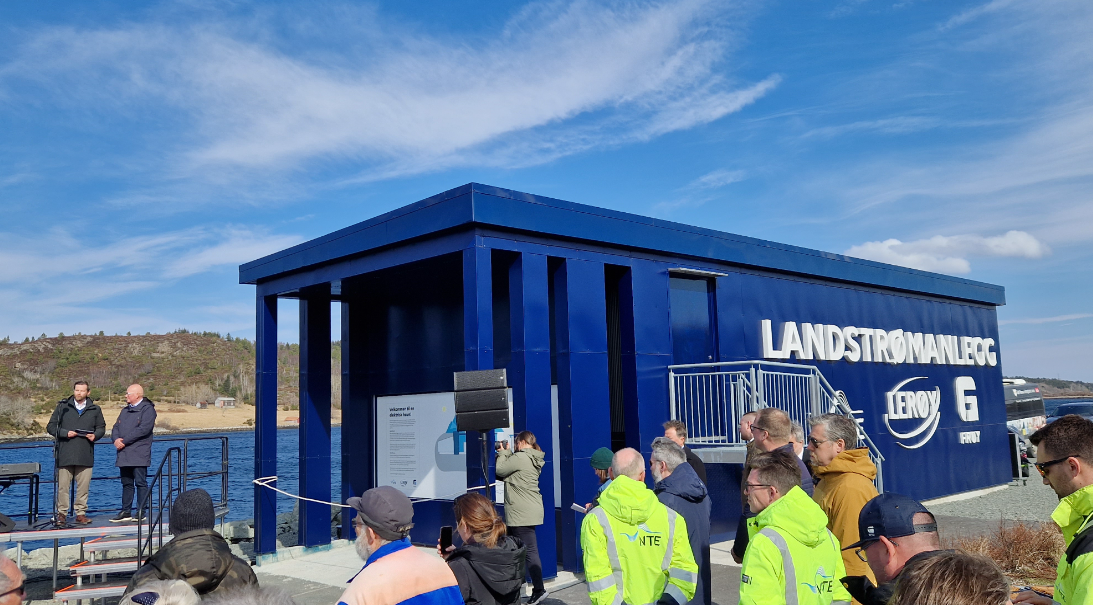
The project is a close collaboration between Lerøy Midt AS as the customer, Frøy Rederi AS which owns the wellboat and Nord Trøndelag electricity utility (NTE) which has designed and built the shore power plant.
In addition to NTE and Frøy Rederi AS, Enova (Norwegian state-owned enterprise owned by the Ministry of Climate and Environment. It provides funding and advice for energy and climate projects) has been involved and taken up to 40 per cent of the budgeted investment costs, which has made it possible to carry out the project.
Gåsø Høvding, like other well boats, is manned around the clock, so the crew in particular will be able to benefit from the silence. This will improve the working conditions and the working environment for everyone involved, both those on board and those who work at our Jøsnøya plant. In addition to the actual transport of salmon from the cages to slaughter, the size of the boat allows the entire biomass from a cage to be handled in one load. If, for example, salmon lice treatment is necessary, the well boat can be filled with fresh water that it can produce itself and treat the entire cage in one operation. The treatment is a gentle treatment against this parasite.The well boat is equipped with today's most modern equipment, which means that the salmon have as good conditions on board as they have in a cage in localities.
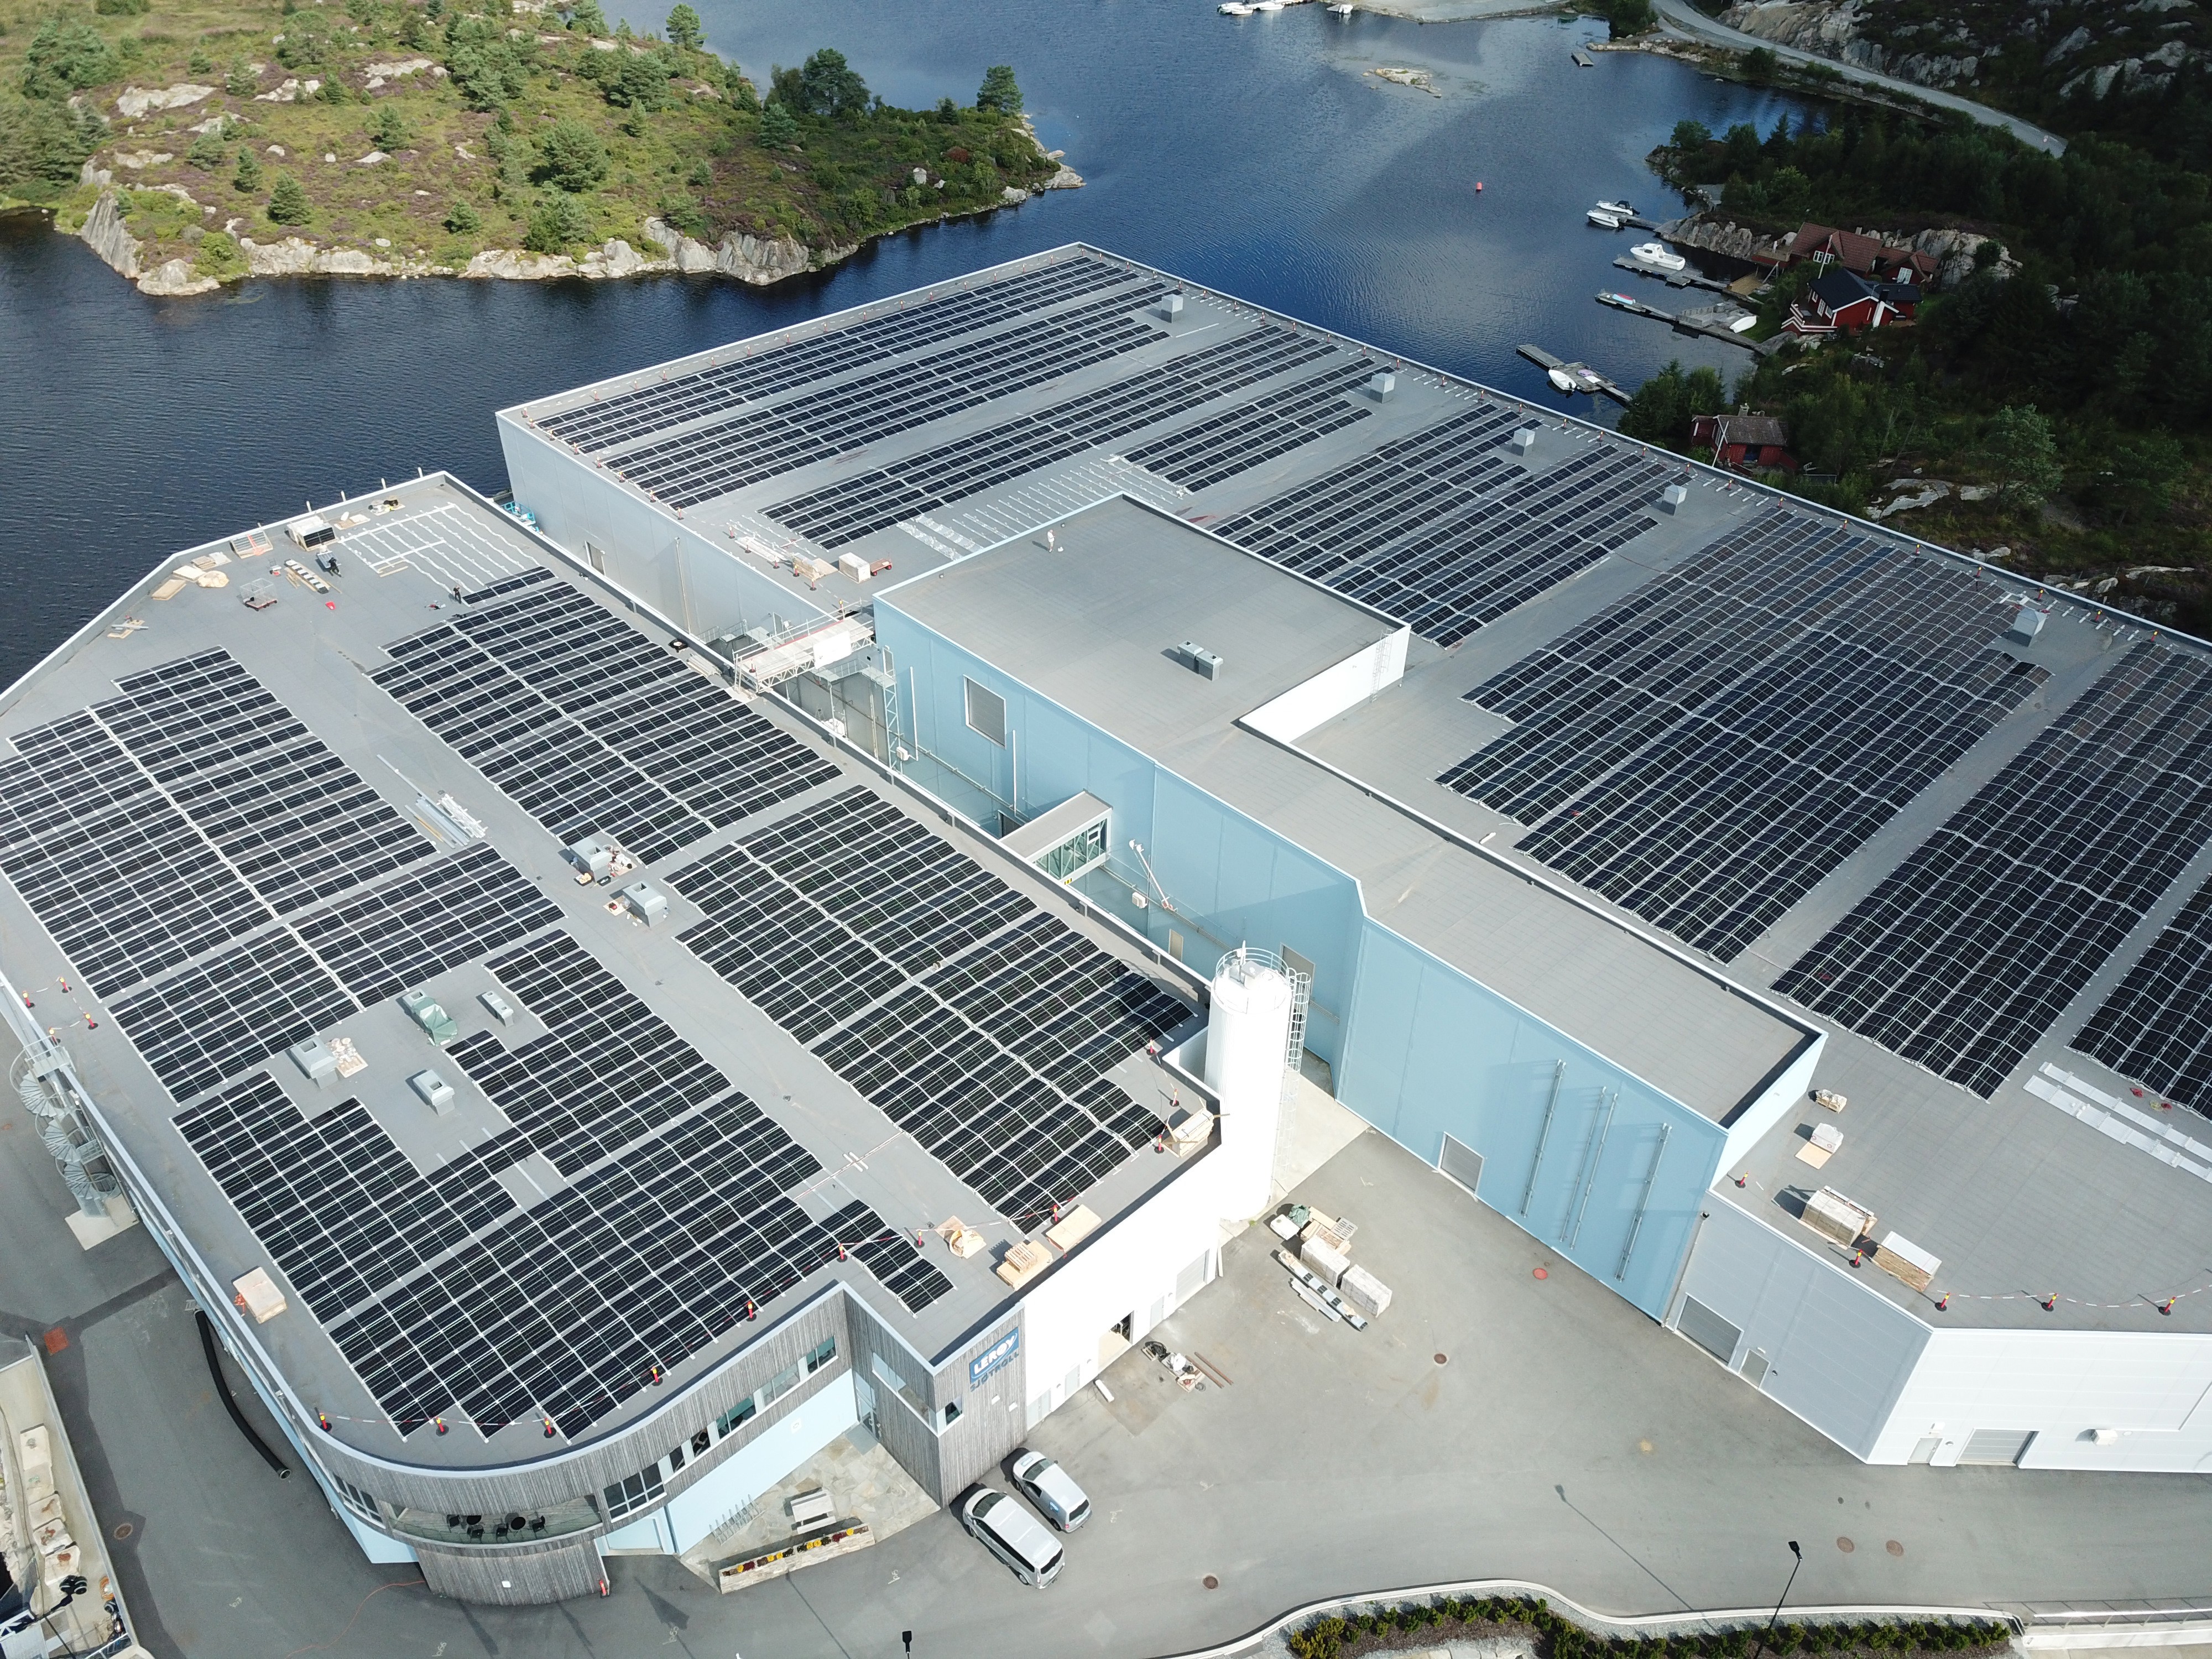
The Group has established different measures in order to reduce its environmental impact; from obtaining power from land, hybrid fleets, floating solar cells, to electric working boats.
Wherever it is possible, the Group seeks to use electricity sourced from land-based powerlines instead of electricity from generators at each production site.
Power from land usually makes good overall economic sense.
Power from land results in:
The further development of power from land should entail a degree of overcapacity, thus enabling electrified boats to be recharged.
More than 80 % of our sites now run on power from land, on remaining sites where the infrastructure is insufficient for land-based electricity, Lerøy Seafood Group is developing hybrid solutions that allow for up to 30% more efficient use of fossil fuels at each site.
The various measures require technological development and a high level of expertise, and in many ways, they represent a breakthrough in the industry.
Lerøy Kjærelva is a RAS (Recirculating Aquaculture Systems) facility, which means that 99% of the water is reused. Because little water resources are used, it is environmentally friendly and sustainable. The RAS technology still requires more electricity to purify the water used. This means that fish from RAS facilities have a higher energy footprint than fish traditional farming, however the solar panels contribute to a lower activity carbon footprint in total.