-
SEARCH
Type your search in the field above

Lerøy is continuously working on improving its monitoring and reporting of greenhouse gas emissions. Information regarding our greenhouse gas emissions is crucial for understanding and responding to environmental challenges as well as to being able to identify improvement opportunities.
2024 was the first year Lerøy reported according to Corporate Sustainability Reporting Directive (CSRD). The Group's Scope 3 accounting was updated considerably ensuring compliance with the requirements in CSRD as well as completeness fo all reporting categories. This is a major change which contributes to much higher GHG-emissions compared to the original 2019-levels. This is a complex area and, in coming years, the Group will continue to work on improving data quality, particularly within the category Purchased Goods and Services.
The Group’s toltal Scope 1, 2 and 3 GHG emissions in 2024 have decreased with 0,6% (12 174 tCO2e) compared to 2023 levels.
Scope 1 emissions have decreased with 7% compared with 2023 levels.
Scope 2 emissions have decreased with 7% compared with 2023 levels.
Scope 3 emissions have increased with 1% compared with 2023 levels.
Science Based Targets
Lerøy Seafood Group has committed to a science-based target which is aligned with the climate targets of the Paris Agreement (2015). The Group aims to achieve a 46% GHG emission reduction (Scope 1+2+3) by 2030, with a 2019 base-year (the 1,5 degree pathway). The science-based target was reviewed and approved by the Science Based Targets initiative (SBTi), with approval date 9th April 2021. This is a fixed (absolute) reduction target that does not change with the Group's growth or changes in production levels, meaning that even if the Group expands its operations, it must still achieve the same total reduction in emissions.
In 2024 Lerøy has reduced its overall Scope 1, 2 and 3 emissions with 4,7% from 2019 levels.
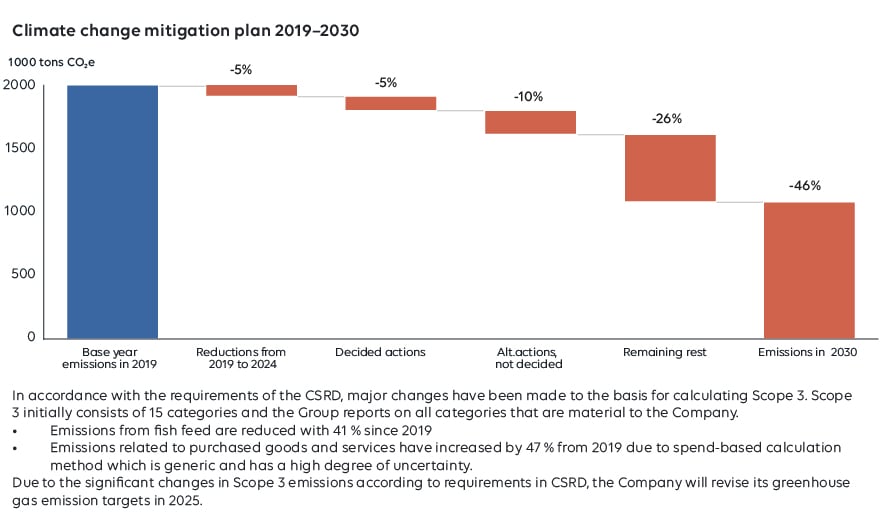
The implementation of CSRD has led to significant changes in GHG calculations for both the base year (2019) and recent reporting year (2024). Lerøy has commenced working on updating its Industry & Energy science-based target as well as setting its Forest, Land and Aquaculture (FLAG) target.
Lerøy has an ambition to become climate neutral by 2050.
The reported emission figures have been collected throughout 2024 both internally and from relevant external suppliers.
Lerøy’s GHG emissions are reported in accordance with the GHG Protocol Corporate Accounting and Reporting Standard. The Group uses operational control approach for consolidating its GHG emissions accounting. It means that emissions from operations, over which Lerøy have operational control, are included in Scope 1 and 2 reporting. Indirect upstream and downstream emissions relating to its operations are accounted for in Scope 3. Reporting units account for their use of fossil fuels, refrigerants, electricity, district heating/cooling, water usage, waste composition (incl. methods of waste disposal).
Climate account statements are consolidated in the same manner as financial statements showing aggregated results for the Group’s entities (reporting units).
The Group’s Scope 3 emissions are reported in accordance with the GHG Protocol Corporate Accounting and Reporting Standard (Corporate Value Chain (Scope 3)). For more detailed information, please, see table Scope 3 Overview per Category below.
Emission factors
Emissions data for Scopes 1, 2 and 3 cover reporting of the following greenhouse gases: carbon dioxide (CO2), methane (CH4), nitrous oxide (N2O), hydrofluorocarbons (HFCs), perfluorocarbons (PFCs) and HFO (hydrofluro-olefins). There are seven main GHGs that contribute to climate change, as covered by the Kyoto Protocol: carbon dioxide (CO2), methane (CH4), nitrous oxide (N2O), hydrofluorocarbons (HFCs), perfluorocarbons (PFCs), sulphur hexafluoride (SF6) and nitrogen trifluoride (NF3).
The Group has had 7 270 tCO2e biogenic CO2 emissions in Scope 1.
Biogenic emissions are CO2 emissions related to the natural carbon cycle, as well as those resulting from the combustion, harvest, digestion, fermentation, decomposition, or processing of biologically based materials.
Scope 1
Sources for Scope 1 emission factors used for calculation of tCO2e are DEFRA (Department for Environmental Food and Rural Affairs, UK Government), 2024, US Environmental Protection Agency (2024), Norwegian Environmental Agency (2023), Linde Gas (2019; 2022; 2024), Honeywell Refrigerants (2014), A-gas (2024).
Scope 2
There are two types of Scope 2 emissions: location-based, and market-based. Location-based Scope 2 emissions are calculated based on the average emissions factor for the grid region where the organisation consumes electricity. Market-based Scope 2 emissions, on the other hand, take into account the specific contractual instruments that an organisation has in place to purchase renewable energy certificates or power purchase agreements.
Sources for Scope 2 emission factors used for calculation of tCO2e are: International Energy Agency (2024), Foreløbig national deklarering af 1 kWh el, 2022 (Energinet, 2023), Generelle eldeklaration 2022 (Energinet, 2023) (Denmark), Norwegian Water Resources and Energy Directorate (NVE) (2024), Fjernkontrollen (2024), Energistyrelsen (2024), Finnish Energy (2024).
Guarantees of Origin (GOs)
The Group has purchased Guarantees of Origin (GOs) in 2024. Information regarding companies which have purchased GOs as well as the percentage share that covers the consumption is reported in Cemasys (the Group’s internal reporting system for GHG emissions accounting).
Regarding market-based emissions – the choice of emission factor using this method is determined by whether the business acquires GOs or not. For electricity without the GOs, the emission factor is based on the remaining electricity production after all GOs for renewable energy are sold. This is residual mix, which is normally substantially higher than the location-based factor.
Scope 3
Sources for Scope 3 emission factors used for calculation of tCO2e are: DEFRA (2024), Års- og bærekraftsrapport 2023 for Vygruppen, study "Investigating the impact of e-bikes on modal share and GHG" (2019), VR Group Annual Report 2023, Avg energy consumption (Norsk elbilforening), Ruter 2023 Miljorapportering and IEA (2024), Ecoinvent 3.11, Greenhouse gas emissions of Norwegian seafood products in 2017. SINTEF study, based on EPD, US Environmental Protection Agency (2024), Information from fish feed and plastic products suppliers.
The categories included in the table are accounted for in the Group’s Scope 3 reporting. The Group does not have downstream leased assets or franchises. The Group also evaluates that use of sold products is not relevant to the Group’s reporting as “sold products” in our context is food which is consumed by the customers.
Scope 1, 2 and 3 GHG Emissions 2024 (incl. % change comparing to base year (2019) and comperative year (2023))
| Base year (2019) | Comperative year (2023) | Recent year (2024) | % change vs base year | % change vs recent year | |
| SCOPE 1 | |||||
| Gross Scope 1 GHG emissions (tCO2e) | 160 138 | 168 064 | 156 638 | -2,19 | -6,8 |
| SCOPE 2 | |||||
| Gross location-based Scope 2 GHG emissions (tCO2e) | 5 917 | 8 821 | 8210 | 38,74 | -6,93 |
| Gross market-based Scope 2 GHG emissions (tCO2e) | 44 685 | 86 428 | 103 036 | 130,59 | 19,22 |
| SCOPE 3 | |||||
| Total gross indirect (Scope 3) GHG emissions (tCO2e) | 1 816 966 | 1 704 628 | 1 728 841 | -4,9 | 1,42 |
| Purchased goods and services(tCO2e) | 1 095 153 | 1 094 207 | 956 393 | -12,7 | -12,59 |
| Capital goods (tCO2e) | 27 046 | 34 443 | 36 376 | 34,5 | 5,61 |
| Fuel and energy related activities (tCO2e) | 36 726 | 42 818 | 39 522 | 7,6 | -7,70 |
| Upstream transportation and distribution (tCO2e) | 543 935 | 421 293 | 533 618 | -1,9 | 26,66 |
| Waste generated in operation (tCO2e) | 3 061 | 3 583 | 4 596 | 50,1 | 28,27 |
| Business travel (tCO2e) | 633 | 1 518 | 798 | 25,9 | -47,48 |
| Employee commuting (tCO2e) | 6 186 | 6 803 | 7 396 | 19,6 | 8,72 |
| Downstream transportation and distribution (tCO2e) | 7 564 | 4 540 | 5 536 | -26,8 | 21,92 |
| Processing of sold products (tCO2e) | 18 488 | 19 566 | 22 102 | 19,5 | 12,96 |
| End of life treatment of products (tCO2e) | 1 882 | 1 886 | 1 644 | -12,7 | -12,82 |
| Investments (tCO2e) | 76 292 | 73 972 | 120 845 | 58,4 | 63,37 |
| Total Scope 1+2+3 (location-based) (tCO2e) | 1 983 021 | 1 881 513 | 1 893 688 | -4,7 | 0,65 |
| Total Scope 1+2+3 (market-based)(tCO2e) | 2 021 788 | 1 959 120 | 1 985 340 | -1,8 | 1,34 |
Scope 1 & 2 GHG emissions per opearating segment
| Operating segment | Scope 1 (tCO2e) | Scope 2 (location-based) (tCO2e) | Scope 2 (market-based) (tCO2e) |
| Farming | 51 588 | 2 369 | 66 956 |
| Wild catch | 102 811 | 373 | 14 888 |
| VAP, Sales & Distribution | 2 239 | 5 268 | 18 018 |
| Total | 156 638 | 8 010 | 99 862 |
| Category | tCO2e | |
|---|---|---|
Purchased goods and services
tCO2e
This category is comprised of two parts: emissions data regarding purchased goods and services, where the information is collected directly from relevant suppliers, and emissions data calculated using the spend-based calculation method, which is generic and embeds a high degree of uncertainty. Data on fish feed carbon intensity is collected from relevant fish feed suppliers. The calculated GHG emissions for purchased fish feed also include transportation emissions, relevant Scope 3 emissions, and emissions related to land use change (LUC), calculated using the economic allocation method. EPS boxes (Styrofoam boxes with lids): Information regarding EPS boxes (number, type, properties) is collected from the Group’s companies throughout the year. Plastic bags/sheets and single-use hygiene plastic items: Information regarding plastic bags/sheets and single-use hygiene plastic items is collected from the Group’s companies throughout the year. Vacuum packaging/film: Information regarding vacuum packaging/film is collected from the Group’s companies throughout the year. Cardboard/carton boxes: Information regarding cardboard/carton boxes is collected from the Group’s companies throughout the year. Rope and feeding tubes: Information regarding rope and feeding tubes is collected from the Group’s companies throughout the year. Municipal water: Information regarding consumed municipal water is collected from the Group's companies throughout the year. Rest of purchased goods and services: Consumption information is derived from financial statements, and emissions are calculated using the spend-based method. |
||
Capital goods
tCO2e
Information derived from financial statements, and emissions are calculated using the spend-based method. |
||
Fuel and energy related activities
tCO2e
Well to Tank (WTT)*. Calculations based on the existing consumption data volumes collected from the Group’s companies throughout the year. The calculation is based on the reported consumption data for Scope 1 and 2 (for more detailed information, see table Total Consumption of Fossil Fuels (Scope 1)). |
||
Upstream transportation and distribution (outbound transportation)
tCO2e
Transportation services (sea transportation, service boats, well boats**). Consumption data collected from sea transportation/ well- boat service providers (calculations include WTT). Transportation of produced products to customers. Information collected from the Group’s Logistics department. The calculations are based on distance from capital to capital. The emission factors used are determined by type of transportation mode. |
||
Waste generated in operations
tCO2e
Waste - data on waste volumes, waste composition (incl. methods of waste disposal) is collected from the Group’s companies throughout the year. |
||
Business travel
tCO2e
Air travel (business travel by air) - information regarding distances traveled is collected from travel agent the Group uses (including WTT). |
||
Employee commuting
tCO2e
Employee commuting – estimation based on SSB (Statistisk Sentralbyrå) for Norwegian operations, TRAFA (Transport Analysis) for Swedish operations, and STATISTA for operations in the Netherlands. For all other operations - INSEE statistics, ACEA (European Automobile Manufacturer’s Association) well as official government websites are used.
|
||
Upstream leased assets
N/A |
||
Downstream transportation and distribution
tCO2e
Downstream transportation and distribution - transportation of products carried out by the customers themselves. Information collected from the Group’s Logistics department. The calculations are based on distance from capital to capital. The emission factors used are determined by the mode of transportation. |
||
Processing of sold products
tCO2e
Processing of sold products – calculations consist of two parts – part one - estimated use of electricity for storage of fish in the country of consumption before the product is sold to end consumer. Part two – estimated emissions related to third party processing. |
||
Use of sold products
N/A |
||
End-of-life treatment of sold products
tCO2e
End of life treatment – organic waste estimated share (%) of non-edible fish. |
||
Downstream leased assets
N/A |
||
Franchises
N/A |
||
Investments
tCO2e
This category covers the greenhouse gas emissions associated with the Group's financial investments and is covering the Group's most significant investments |
||
*Well-to-tank (WTT) refers to the greenhouse gas (GHG) emissions that occur during the production, processing, and transportation of fuel until it is ready for use and covers the entire upstream process, from extracting raw mataerials to delivering the fuel for use in vehicles or facilities.
**Well-boats and service boats which are not classified as operating leases (ref. definition IFRS 16) are included in Scope 3 emissions since Lerøy does not have operational control over the leased assets held under an operating lease.
For more detailed information regarding the categories, please visit Corporate Value Chain (Scope 3) Accounting standard
Emissions from feed production 2024, incl. land luse
| GHG emissions from fish feed | tCO2e |
| Total GHG emissions from fish feed production 2024 | 444 929 |
| GHG emissions from fish feed from Land Use Change (LUC) | 46 963 |
GHG emissions intensity ratio per operating segment
| Operating segment | Emissions (Scope 1+2) emissions (mt) 2024 | Production volume (mt) 2024 (Farming segment - live weight equivalent) | Intensity (total GHG emissions/ total production volume) 2024 |
| Farming | 53 955 | 332 901 | 0,16 |
| Wild Catch | 103 184 | 163 591 | 0,63 |
| VAP, Sales and Distribution | 7 706 | 79 859 | 0,10 |
| Total | 164 845 | 576 350 | 0,29 |