-
SEARCH
Type your search in the field above

Climate change refers to the long term changes in the Earth’s climate system, including, changes in temperature, precipitation, and weather patterns, that are primarily caused by human activity.
Climate changes can cause several negative impacts such as:
Rising sea levels: As global temperature rise, glaciers and ice sheets melt, and sea levels rise. This could lead to flooding of low-lying areas and displacement of millions of people.
Extreme weather events: Climate change leads to more frequent and severe weather events, including hurricanes, droughts, heatwaves and wildfires. These events can cause significant damage to infrastructure, homes and ecosystems.
Loss of biodiversity: As temperatures rise, many species may be unable to adapt to changing conditions and may go extinct. This could have cascading effects on ecosystem and food chains.
Water scarcity: Climate change is expected to lead to more frequent and severe droughts, which could lead to water scarcity in many regions. This can potentially cause conflicts over water resources and harm agriculture and food production.
Health impacts: Climate change could lead to increased incidence of several diseases. This could have significant impacts on public health and healthcare systems.
Economic impacts: Climate change could lead to significant economic impacts, including damage to infrastructure, lost productivity, and higher costs for disaster relief. These impacts could be particularly severe for low-income communities and developing countries.
Lerøy, as any other organization, has an impact on the climate in several ways:
The organization emits GHG through our operations. Lerøy is performing GHG reporting (Scope 1, 2 and 3) in order to monitor and control its own and relevant supply chain emissions in order to be able to take appropriate measures for reducing its GHG emissions.
The organization also implicitly contributes to deforestation by purchasing fish feed. Lerøy is working proactively with its business partners (including fish feed suppliers) to develop alternative fish feed ingredients.
The organization generates waste, including plastic waste, however its is taking appropriate steps to reduce its contribution to pollution.
Lerøy has developed Climate policy which sets out a range of actions and measures aimed at addressing climate change and introducing sustainable business practices. The goal of the policy is to mitigate the negative impacts of climate change and reduce risks associated with it.
Actions taken to manage the topic and related impacts:
Lerøy is continuously working on improving its monitoring and reporting of greenhouse gas emissions. Information regarding our greenhouse gas emissions is crucial for understanding and responding to environmental challenges as well as to being able to identify improvement opportunities.
In 2022 the Company carried out an extensive project which aimed to enhance Lerøy’s reporting processes and practices. The Group has strengthened its reporting routines, however we acknowledge that we need to focus on further improvement of quality of the reported data to ensure that the reporting is more accurate, complete and transparent.
A key change from previous year’s reporting is that a major part of well-boat and service boat activity (time chartered vessels) is moved from Scope 3 to Scope 1 reporting including operating leases (as defined by IFRS 16) in Scope 1 accounting (for more detailed information regarding operating leases, please, visit https://www.ifrs.org/). This change has a significant effect on Scope 1 reporting, resulting in 20% increase of Scope 1 emissions compared to 2021 levels. Emissions from well-boats and service boats represent approximately 22% of total Scope 1 emissions in 2022. Lerøy is aware of the effect that the changed and improved reporting practice has on the climate accounts and is planning on adjusting/ correcting its climate reports for previous years in order to improve the transparency, quality and comparability of the reported information. This major change in reporting will also be reflected in re-calculation of both base year (2019) emissions and Lerøy’s Science-Based Target. This process will commence in Q2 2023.
Lerøy has also established a closer cooperation with shipping companies that provide well-boat and service boat services and has worked on enabling the shipping companies to improve their procedures for gathering and reporting of relevant data as well as on strengthening reporting processes internally. A key takeaway from 2022 is that Lerøy needs to both intensify and strengthen its daily dialogue with these suppliers in order to secure better data flow and exchange.
The Group has completed a comprehensive analysis of climate related risks and opportunities which the Group is facing over short, medium and long term. The analysis has confirmed the importance of measuring, monitoring and reporting on our environmental performance. The analysis is discussed in greater detail in the Group’s Task Force Climate-Related Financial Disclosures (TCFD) report
A new TFCD report was released in Q2 2023.
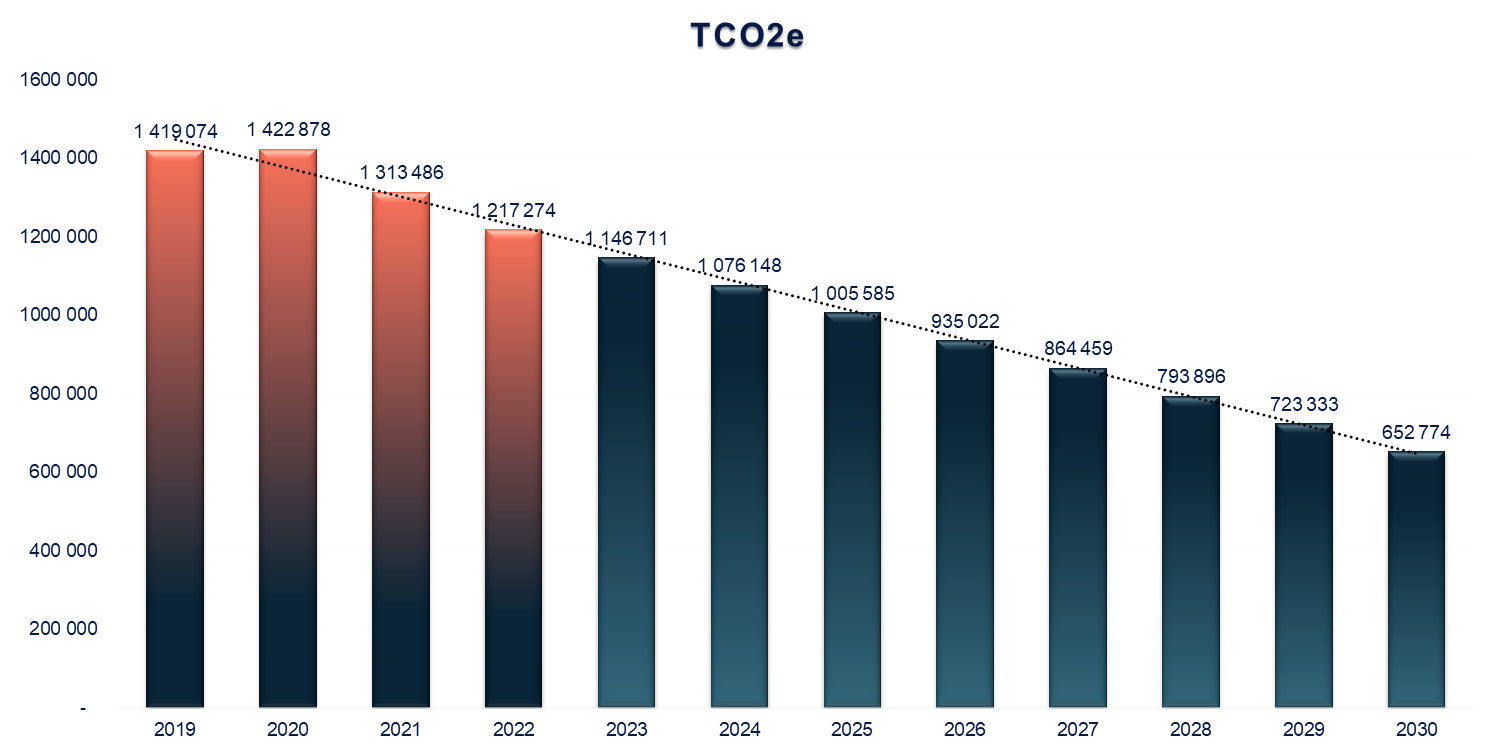
Lerøy has set ambitious science-based targets to reduce our carbon footprint: We aim to reduce our CO2e emissions by 46% by 2030 compared to 2019 levels. (ref: Climate Policy). Lerøy has defined 2019 as the base year for our science-based climate target as this was the first year all operating segments in the Group were conducting greenhouse gas emission reporting for Scope 1, 2 and 3. Lerøy has also committed to become climate neutral by 2050.
The reported emission figures have been collected throughout 2022 from relevant suppliers via invoices and are based on the same data sources as the figures reported in Lerøy’s 2021 annual report.
Lerøy’s greenhouse gas emissions are reported in accordance with the GHG Protocol Corporate Accounting and Reporting Standard. The Group uses the operational control approach for consolidating GHG emissions accounting. It means that emissions from operations, over which it has operational control, are included in Scope 1 and 2 reporting, however indirect upstream and downstream emissions relating to its operations are accounted for in Scope 3. Reporting units account for their use of fossil fuels, refrigerants, electricity, district heating/cooling, water usage, waste composition (incl. methods of waste disposal). Climate account statements are consolidated in the same manner as financial statements showing aggregated results for the Group’s entities (reporting units).
The Group’s Scope 3 emissions are reported in accordance with the GHG Protocol Corporate Accounting and Reporting Standard (Corporate Value Chain (Scope 3)). The Group has mapped its “carbon hotspots” and identified the main sources of greenhouse gas emissions which are included in the Group’s Scope 3 climate accounts. For more detailed information, please, see table Scope 3 Overview per Category below.
Emission factors
Emissions data for Scope 1, 2 and 3 covers reporting of the following greenhouse gases: carbon dioxide (CO2), methane (CH4), nitrous oxide (N2O), hydrofluorocarbons (HFCs) and perfluorocarbons (PFCs). The Group has not reported any biogenic CO2 emissions in Scope 1 or Scope 3 in 2022. We will hold off doing so until the methodology on how to calculate biogenic emissions will become more established.
Scope 1
Sources for Scope 1 emission factors used for calculation of tCO2e are DEFRA (Department for Environmental Food and Rural Affairs, UK Government), 2022, National Standard Emission Factors (Norwegian Environment Agency), 24th February 2015, Linde Gas (Industrial gasses) 2022, A-gas Product information guide, product information summary-refrigeration Library - refrigerants - A-gas product information guide, 2022.
Scope 2
There are two types of Scope 2 emissions: location based and market based. Location-based Scope 2 emissions are calculated based on the average emissions factor for the grid region where the organization consumes electricity. Marked-based Scope 2 emissions, on the other hand, take into account the specific contractual instruments that an organization has in place to purchase renewable energy certificates or power purchase agreements.
The source for location-based Scope 2 emission factors used for calculation of Lerøy’s Scope 2 CO2e is the International Energy Agency (IEA). The Nordic electricity mix factor is developed by Cemasys (sustainability consultancy company and service provider for registration and calculation of climate accounts) and covers the weighted production in Sweden, Norway, Finland and Denmark reflecting the common Nord Pool market area. The factors used are based on national gross electricity production mixes on a 2 year "lag". The Nordic electricity mix used to calculate the Group’s location-based Scope 2 emissions for 2022 are based on 2020 factors. The emission factors from IEA used in the location-based calculation of scope 2 emissions from electricity use are taken from the document “IEA Emission factors” published in 2022. Since 2020, Cemasys no longer uses a 3-year rolling average, but instead uses the annual figure (2 years "lag", example: the emission factor for 2021 is based on the figure for 2019. The datasets used are "CO2 emission factors for electricity only generation (CHP electricity included) for world countries (in CO2 per kWh)" and "CH4 and N2O emission factors for electricity generation (based on default IPCC factors) (in CO2eq per kWh)". This means that the emission factors include emissions of CO2, CH4 and N2O (converted into CO2e). Electricity trade has not been taken into account.
IEA:s explanations of the datasets:
“The emission factors are converted from gCH4 and gN2O to gCO2eq using the 100-year Global Warming Potential (GWP). For the purpose of comparability with international data submission guidelines, the factors from the 4th Assessment of the IPCC are used. 1gCH4 = 25 gCO2eq”
The Group has purchased Guarantees of Origin (GOs) in 2022. Information regarding companies which have purchased GOs as well as the percentage share that covers the consumption is reported in Cemasys (the Group’s internal reporting system for GHG emissions accounting).
Regarding market-based emissions – the choice of emission factor using this method is determined by whether the business acquires Guarantees of Origin or not. For electricity without the GOs, the emission factor is based on the remaining electricity production after all GOs for renewable energy are sold. This is residual mix, which is normally substantially higher than the location-based factor.
Sources for Scope 3 emission factors used for calculation of tCO2e are DEFRA (Department for Environmental Food and Rural Affairs, UK Government) 2022, Greenhouse gas emissions of Norwegian seafood products in 2017, SINTEF study, Emission factors from fish feed producers 2022, Database Ecoinvent 3.8 (2022) as well as supplier specific emission factors.
Info: Expand table for more details
| Category | tCO2e | |
|---|---|---|
Purchased goods and services
|
||
Capital goods
Information regarding used construction materials (concrete and steel used in supplementary construction of Belsvik facility (Lerøy Midt). Belsvik facility is a hatchery-produced (on-growing) fish facility. The facility was extended with a post smolt facility in 2022. |
||
Fuel and energy related activities
Well to Tank (WTT)**. Calculations based on the existing consumption data volumes collected from the Group’s companies throughout the year. The calculation is based on the reported consumption data for Scope 1 and 2 (for more detailed information, see table Total Consumption of Fossil Fuels (Scope 1). |
||
Upstream transportation and distribution (outbound transportation)
Transportation services (sea transportation, service boats, well boats***). Consumption data collected from sea transportation/ well- boat service providers (calculations include WTT). Transportation of produced products to customers. Information collected from the Group’s Logistics department. The calculations are based on distance from capital to capital. The emission factors used are determined by type of transportation mode. |
||
Waste generated in operations
Waste - data on waste volumes, waste composition (incl. methods of waste disposal) is collected from the Group’s companies throughout the year. |
||
Business travel
Air travel (business travel by air) - information regarding distances traveled is collected from travel agent the Group uses (including WTT). |
||
Employee commuting
Employee commuting – estimation based on SSB (Statistisk Sentralbyrå) for Norwegian operations, TRAFA (Transport Analysis) for Swedish operations, and STATISTA for operations in the Netherlands. For all other operations - INSEE statistics as well as official government websites are used. |
||
Upstream leased assets
N/A |
||
Downstream transportation and distribution
Downstream transportation and distribution - transportation of products carried out by the customers themselves. Information collected from the Group’s Logistics department. The calculations are based on distance from capital to capital. The emission factors used are determined by the mode of transportation. |
||
Processing of sold products
Processing of sold products – calculations consist of two parts – part one - estimated use of electricity for storage of fish in the country of consumption before the product is sold to end consumer. Part two – estimated emissions related to third party processing. |
||
Use of sold products
N/A |
||
End-of-life treatment of sold products
End of life treatment – organic waste estimated share (%) of non-edible fish. |
||
Downstream leased assets
N/A |
||
Franchises
N/A |
||
Investments
N/A |
||
*For more detailed information regarding the categories, please visit Corporate Value Chain (Scope 3) Accounting standard
**A Well-to-Tank emissions factor, also known as upstream or indirect emissions, is an average of all the GHG emissions released into the atmosphere from the production, processing and delivery of a fuel or energy vector.
*** Well-boats and service boats which are not classified as operating leases (ref. definition IFRS 16) are included in Scope 3 emissions since Lerøy does not have operational control over the leased assets held under an operating lease.
| Fossil fuels and electricity | Unit | 2018 | 2019 | 2020 | 2021 | 2022 | |||||||||||||||||||||
|---|---|---|---|---|---|---|---|---|---|---|---|---|---|---|---|---|---|---|---|---|---|---|---|---|---|---|---|
Diesel*
|
|||||||||||||||||||||||||||
Marine gas oil (MGO)
|
|||||||||||||||||||||||||||
Petrol**
|
|||||||||||||||||||||||||||
Biodiesel fuel (HVO)
|
|||||||||||||||||||||||||||
LPG (Propane)
|
|||||||||||||||||||||||||||
Natural gas
|
|||||||||||||||||||||||||||
LPG (Propane)
|
|||||||||||||||||||||||||||
Fuel oil
|
|||||||||||||||||||||||||||
Refrigerants
|
|||||||||||||||||||||||||||
*Diesel includes Diesel (100% fossil), Diesel (B7) and Diesel (B30 HVO)
**Petrol includes Petrol (100% fossil) and Petrol (E5)
NB! Scope 3 emissions are not included in the GHG emissions intensity ratio calculation, however Scope 3 is a significant contributor to GHG emission intensity. The Group is working on improving its reporting routines to be able to allocate Scope 3 emissions to the respective segments in the Group.
| Unit | 2018 | 2019 | 2020 | 2021 | 2022 | ||||||||||||||||||||||
|---|---|---|---|---|---|---|---|---|---|---|---|---|---|---|---|---|---|---|---|---|---|---|---|---|---|---|---|
Group
|
|||||||||||||||||||||||||||
| Unit | 2018 | 2019 | 2020 | 2021 | 2022 | ||||||||||||||||||||||
|---|---|---|---|---|---|---|---|---|---|---|---|---|---|---|---|---|---|---|---|---|---|---|---|---|---|---|---|
Farming
|
|||||||||||||||||||||||||||
Wildcatch
|
|||||||||||||||||||||||||||
VAP, Sales & Distribution
|
|||||||||||||||||||||||||||
Group
|
|||||||||||||||||||||||||||
Annual Scope 2 Market-based GHG emissions:
|
|||||||||||||||||||||||||||
CO2e emissions for fish are in general low. When compared with other types of proteins we eat, salmon has the lowest eco-footprint.
Scope 1 emissions have increased by 20% compared to 2021 levels. The reason for the change is amended reporting practices (ref. chapter Emissions 2022 in Sustainability library) as well as improved quality of data.
Scope 2 emissions have decreased by 6,8% compared to 2021 levels due to use of cleaner sources of energy.
Scope 3 emissions have decreased by 10,26% due to significant decrease in emissions from fish feed as well as moving well and service boat emissions to Scope 1 (ref. chapter Emissions 2022 in Sustainability library).
In 2022 total GHG emissions for Lerøy Seafood Group (Scope 1,2 and3) have decreased by 7% compared to 2021 levels.
TOTAL CONSUMPTION OF FOSSIL FUELS (SCOPE 1)
| Unit | 2018 | 2019 | 2020 | 2021 | 2022 | |
| Farming | ||||||
| Diesel* | liter | 2 262 514 | 2 591 190 | 2 654 552 | 2 893 492 | 6 264 465 |
| Marin gas oil (MGO) | liter | 3 540 849 | 3 656 064 | 3 525 430 | 3 461 428 | 12 994 859 |
| Petrol** | liter | 189 287 | 264 596 | 414 031 | 471 823 | 558 852 |
| Biodiesel fuel (HVO) | liter | - | - | - | - | - |
| LPG (Propane) | kg | - | - | - | - | - |
| Fuel oil | liter | 26 202 | 84 271 | 206 904 | 45 916 | 661 |
| Refrigerants | kg | 228 | 1 670 | 478 | 379 | 140 |
| Wildcatch | ||||||
| Diesel* | liter | 3 192 | 9 781 | 8 033 | 10 789 | 7 927 |
| Marin gass olje (MGO) | liter | 36 538 544 | 35 559 152 | 38 723 297 | 43 309 534 | 40 341 435 |
| LPG (Propane) | kg | 1502 | 211 | 780 | 2 013 | 704 |
| LPG (Propane) | liter | - | 203 | 1 136 | - | - |
| Petrol** | kg | - | - | 503 | 486 | 169 |
| Refrigerants | kg | 504 | - | - | - | 677 |
| VAP, Sales & Distribution | ||||||
| Diesel* | liter | 196 923 | 558 697 | 404 058 | 476 053 | 600 168 |
| Petrol** | liter | 25 154 | 24 260 | 28 087 | 44 521 | 107 091 |
| Natural gas | m3 | 18 620 | 24 266 | 78 553 | 189 628 | 478 537 |
| LPG (Propane) | kg | 957 | 50 935 | 53 825 | 36 588 | 79 842 |
| LPG (Propane) | liter | - | - | 132 | - | - |
| Fuel oil | liter | 19 254 | 17 525 | 18 051 | 21 795 | - |
| Refrigerants | kg | 74 | 3 | 93 | 1 680 | 5 578 |
| Group | ||||||
| Diesel* | liter | 2 462 629 | 3 159 669 | 3 066 643 | 3 380 334 | 6 872 560 |
| Marin gass olje (MGO) | liter | 40 079 393 | 39 183 756 | 42 248 727 | 46 770 962 | 53 336 294 |
| Petrol** | liter | 214 441 | 288 856 | 442 621 | 516 830 | 666 111 |
| Biodiesel fuel (HVO) | liter | - | - | - | - | - |
| Natural gas | m3 | 18620 | 24 266 | 78 553 | 189 628 | 478 537 |
| LPG (Propane) | kg | 2459 | 51 146 | 54 605 | 38 601 | 80 546 |
| LPG (Propane) | liter | - | 203 | 1 268 | - | - |
| Fuel oil | liter | 45 456 | 101 796 | 224 955 | 67 711 | 661 |
| Refrigerants | kg | 806 | 1 673 | 571 | 2 059 | 6 395 |
*Diesel includes Diesel (100% fossil), Diesel (B7) and Diesel (B30 HVO)
**Petrol includes Petrol (100% fossil) and Petrol (E5)
Governments, financial institutions, investors, our customers and other important stakeholders are setting higher demands and requirements related to climate change awareness. This has created a call for companies to disclose how climate change is affecting their financial performance and strategy.
Seafood has a smaller carbon footprint than other animal productions systems. With a growing population the world needs food, and ocean-based diets have been pointed out an important contributor to increasing the world’s food production. However, although seafood is considered as a healthy and sustainable source of protein, existing operations and exploiting new opportunities need to be done in a responsible and sustainable manner.
The Group believes that the increased focus on climate and environmental sustainability represents a significant opportunity for the Group, the seafood industry and for Norway. In this context, it is the responsibility of both the industry and political authorities to exploit these opportunities. It requires reason and knowledge to prevail in the years to come.
The Group's operations are closely linked to the natural conditions in Norwegian and international freshwater sources and marine areas. Access to clean water and clean seas is a prerequisite for the Group's operations.
LSG has set ambitious science-based targets to actively to reduce our overall carbon footprint and also focusing on reducing the environmental impact of the Group's activities.
The Task Force on Climate-related Financial Disclosure (TCFD) framework is designed to improve the clarity, consistency and reliability on climate-related disclosures for a better understanding of climate-related risks and opportunities and how to implement measures to mitigate such risks.
In 2020 the Group conducted an in depth interview analysis with 20 key internal and external stakeholders to identify what is considered to be the Group’s main risks and opportunities related to climate change.
The qualitative scenario analysis summarized below is aligned with the TCFD recommendations. The Group’s main vision is to be the most profitable global supplier of sustainable high-quality seafood and sustainability is at the core of every important strategy decision we make. The Group acknowledges the importance of better disclosures and aims to integrate the complete TCFD recommendations with quantifications of potential financial impact in due course.
CLIMATE RELATED RISKS & OPPORTUNITIES
The transition to a low-carbon society will potentially reduce physical risks from climate change, but it will also lead to transition risks, which need to be identified, assessed and managed.
Below we highlight the key transition and physical risks and opportunities that were identified in the interview analysis.
Transition Risks
Transition risks are risks associated in the transition to a low-carbon society. It involves risks related to regulatory changes, legal and financial responsibility for damage caused by climate change, new technology, changes in the market and consumer behaviour as well as reputational risk.
POLICY AND LEGAL
Climate policies aim to mitigate the negative effects of climate change. Policy changes and new regulations can pose a negative risk for companies through failure of compliance, or through increased costs such as carbon pricing and increased prices of feed ingredients.
For Lerøy (“LSG”), the introduction of new and more stringent climate-related regulations were identified as a risk mainly in two areas: potential new regulations that could have a significant financial impact on operations, and potential new regulations relating to the purchase of raw materials.
An increase in regional, national, international and industry specific regulations is likely to impact LSG financially through increased operating costs and decreased revenue.
Potential new climate-related regulations impacting operations and purchase of raw materials:
Overall:
Farming
Wild-catch
TECHNOLOGY
Development of new technological solutions will function as an effort to reduce carbon emissions and can represent both opportunities and risk. Unsuccessful investments in new technologies, or the cost of transitioning to lower emission technologies may pose a significant financial risk to LSG:
MARKET
Climate change awareness has created a shift in demand for lower emission foods. Failure to comply to stakeholder environmental demands may lead to a reduced demand for our products, impacting our revenue.
Demand
REPUTATION
Climate change has been identified as a potential source of reputational risk tied to changing customer or community perception of a company’s contribution to or detraction from the transition to a lower-carbon economy. By not meeting the expectations from stakeholders, the reputation of LSG may be damaged and directly impact consumer behaviour.
Brand specific:
Industry wide:
Physical climate-related risks
Physical impacts are risks associated with direct implications of climate change, and can be event driven such more extreme weather (acute) or longer-term shifts in climate patterns such as higher temperatures (chronic)
Financial implications vary from costs associated with damage of sites and vessels to the larger impacts associated with loss of fish and less stable access to raw materials as well indirect impacts from supply chain disruption,, Physical risks could have a direct impact on LSG’s production capacity and revenue growth.
ACUTE
Acute physical risks are risks associated with more frequent extreme weather such as storms, hurricanes, floods and heavy precipitation of rain and snow. Such events may impact LSG’s direct operations, or cause disruptions in the supply chain.
For LSG, any events delaying production has a financial implication. It is therefore crucial for LSG to be prepared for such scenarios. Acute physical risks can also impact the supply of raw materials used in fish feed, which is a extremely important for LSG.
Direct operations
Supply chain
CHRONIC
Chronic climate risks are risks derived from longer-term shifts in climate patterns, such as higher temperatures in air and sea, and change in sea levels. The sea is LSG’s biggest asset, and any changes in sea levels or temperature that directly impacts the marine ecosystem can potentially impact the company’s livelihood in the long run.
Rising sea temperatures:
Wild catch
Farming
Rising air temperatures
OPPORTUNITIES
As markets and consumer behaviour shift in response to climate change, the seafood industry have a substantial opportunity to harness solutions addressing climate change. Companies prepared to manage and mitigate climate-related risks, will obtain a competitive advantage.
Technological improvements may lead to resource efficiency. Additionally, an increasing supply of low-/zero-emission energy sources, combined with potential carbon pricing, may create a shift in demand for these services.
Explore market shifts towards climate friendly products and services:
Explore opportunities that follow a new positioning in a low carbon market:
Exploit collaborative efforts:
Resource efficiency
Resource efficiency as equivalent to cost efficiency and can be obtained through:
SURVEY RANKING:
Below we highlight the top three climate-related risks and opportunities that were identified as the most strategically and financially important for LSG based on the results from the survey:
TOP 3 RISKS:
TOP 3 OPPORTUNITIES:
The below document with tables summarize the findings from the interviews.
Note that the risk and opportunity assessments are provisional and will be further developed. The heatmapping is result of a preliminary assessment of risk level based on interview input. We intent to stress-test this resilience in the future by using scenarios and quantitative analysis.
Potential financial impact is categorized with the following colours in the summary table.
![]()
Sustainable development is based on three fundamental pillars:
Environment - We must take care of the environment. All activity affects the environment, but we must ensure that the environment will return to its original state after use in order to be able to operate in an eternal perspective.
Social - we must look after the people and the local environment. Ensure that human rights are safeguarded for employees who are involved directly or indirectly in our value chain and contribute positively to the local environment around us.
Governance – We must comply with laws and regulations, protect our reputation and operate profitably.

We will reduce our greenhouse gas emissions by 46% by 2030. Lerøy has an ambition to be climate neutral by 2050.
In order to reach our greenhouse gas emission reduction target, we have initiated 3 main projects that will contribute to reduction of greenhouse gas emissions in Lerøy. These projects are targeting our most significat greenhouse gas emissions sources.
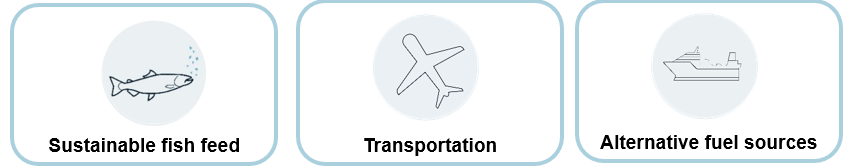
Raw materials for fish feed have been proven to contribute the highest greenhouse gas emissions. It constitutes a large part of Lerøy's Scope 3 category "Purchased goods and services" (527 804,8 tCO2e in 2022). Lerøy therefore wants to prioritize raw materials that contribute to reaching our grennhouse gas emissions reduction target without compromising biodiversity and other important ESG aspects.
The company has initiated these innovative projects to reduce GHG emissions:
Upstream transportation and distribution is our second largest greenhouse emisson source, and resulted in 433 909,4 tCO2e in 2022. Transportation of produced products to customers is the largest contributar, prioritization of optimalization of transport weight and develop technology to be able to choose more environment friendly transportation is crucial.
Leroy is participating in different innovation programs on how to create alternatives for fossile fules like MGO.
Our total Scope 1 emissions in 2022 was 169 913 tco2e. In the Wildcatch segment Lerøy Havfisk is a part of an innovation program exploring how to use green ammonia to reduce the dependency of MGO, in addidtion the Farming segment which has electrified a large proportion of its of farm locations.
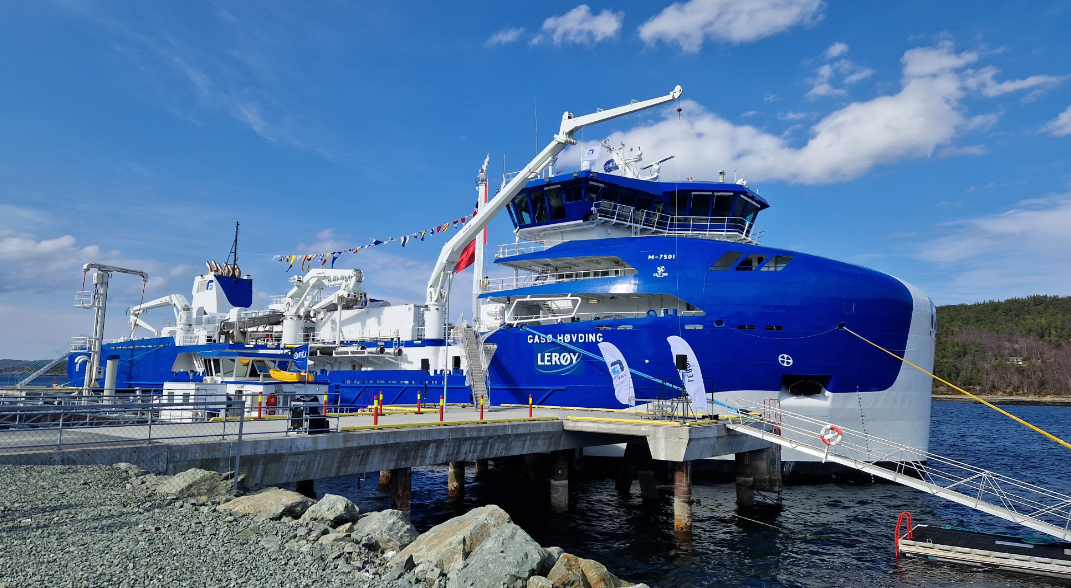
Electrification of fleets, well boats and workboats
The world's largest shore current system for well boats is ready for use at Hitra. This investment is one of many measures we are taking to achieve the company's goal of reducing greenhouse gas emissions by 46% by 2030. Our goal is to create the world's most efficient and sustainable value chain for seafood, says Harald Larssen, general manager of Lerøy Midt.
Lerøy Midt has chartered the wellboat Gåsø Høvding, which has been built to run all systems on board completely electrically for direct delivery of salmon to our slaughterhouse on Jøsnøya in Hitra. The well boat is the world's largest with more than double well volume comparing to normal well boats. The well boat is owned by Frøy Rederi AS, which has invested large sums in the system for electric operation.
With the investment in the high-voltage shore power plant, Lerøy Midt has the potential to significantly reduce nitrogen oxide (NOx) emissions and emissions of several thousand tonnes of CO2 equivalents annually.
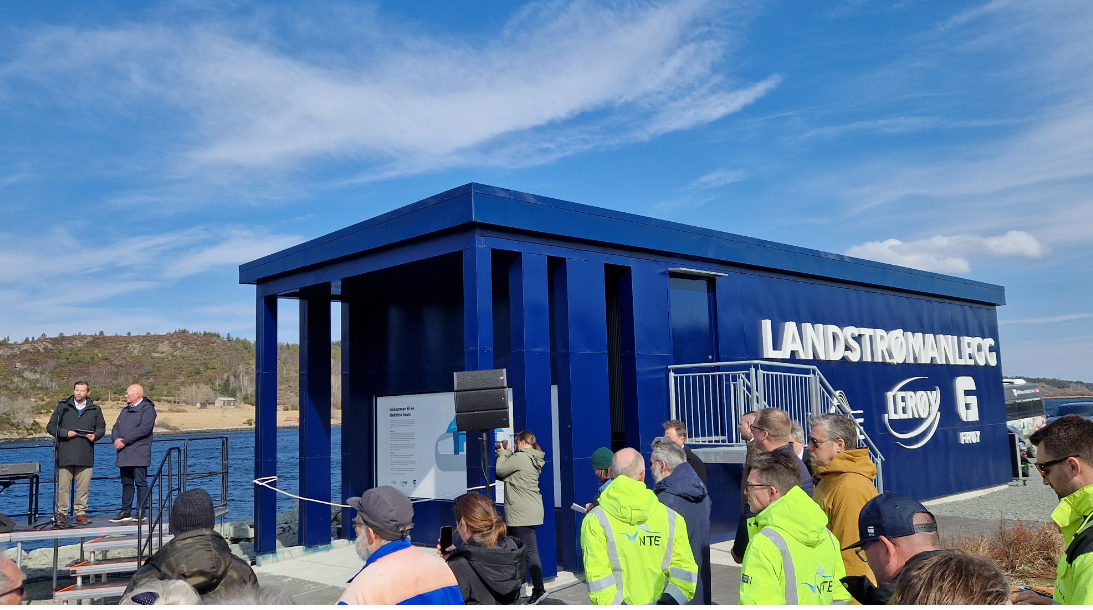
The project is a close collaboration between Lerøy Midt AS as the customer, Frøy Rederi AS which owns the wellboat and Nord Trøndelag electricity utility (NTE) which has designed and built the shore power plant.
In addition to NTE and Frøy Rederi AS, Enova (Norwegian state-owned enterprise owned by the Ministry of Climate and Environment. It provides funding and advice for energy and climate projects) has been involved and taken up to 40 per cent of the budgeted investment costs, which has made it possible to carry out the project.
Gåsø Høvding, like other well boats, is manned around the clock, so the crew in particular will be able to benefit from the silence. This will improve the working conditions and the working environment for everyone involved, both those on board and those who work at our Jøsnøya plant. In addition to the actual transport of salmon from the cages to slaughter, the size of the boat allows the entire biomass from a cage to be handled in one load. If, for example, salmon lice treatment is necessary, the well boat can be filled with fresh water that it can produce itself and treat the entire cage in one operation. The treatment is a gentle treatment against this parasite.The well boat is equipped with today's most modern equipment, which means that the salmon have as good conditions on board as they have in a cage in localities.
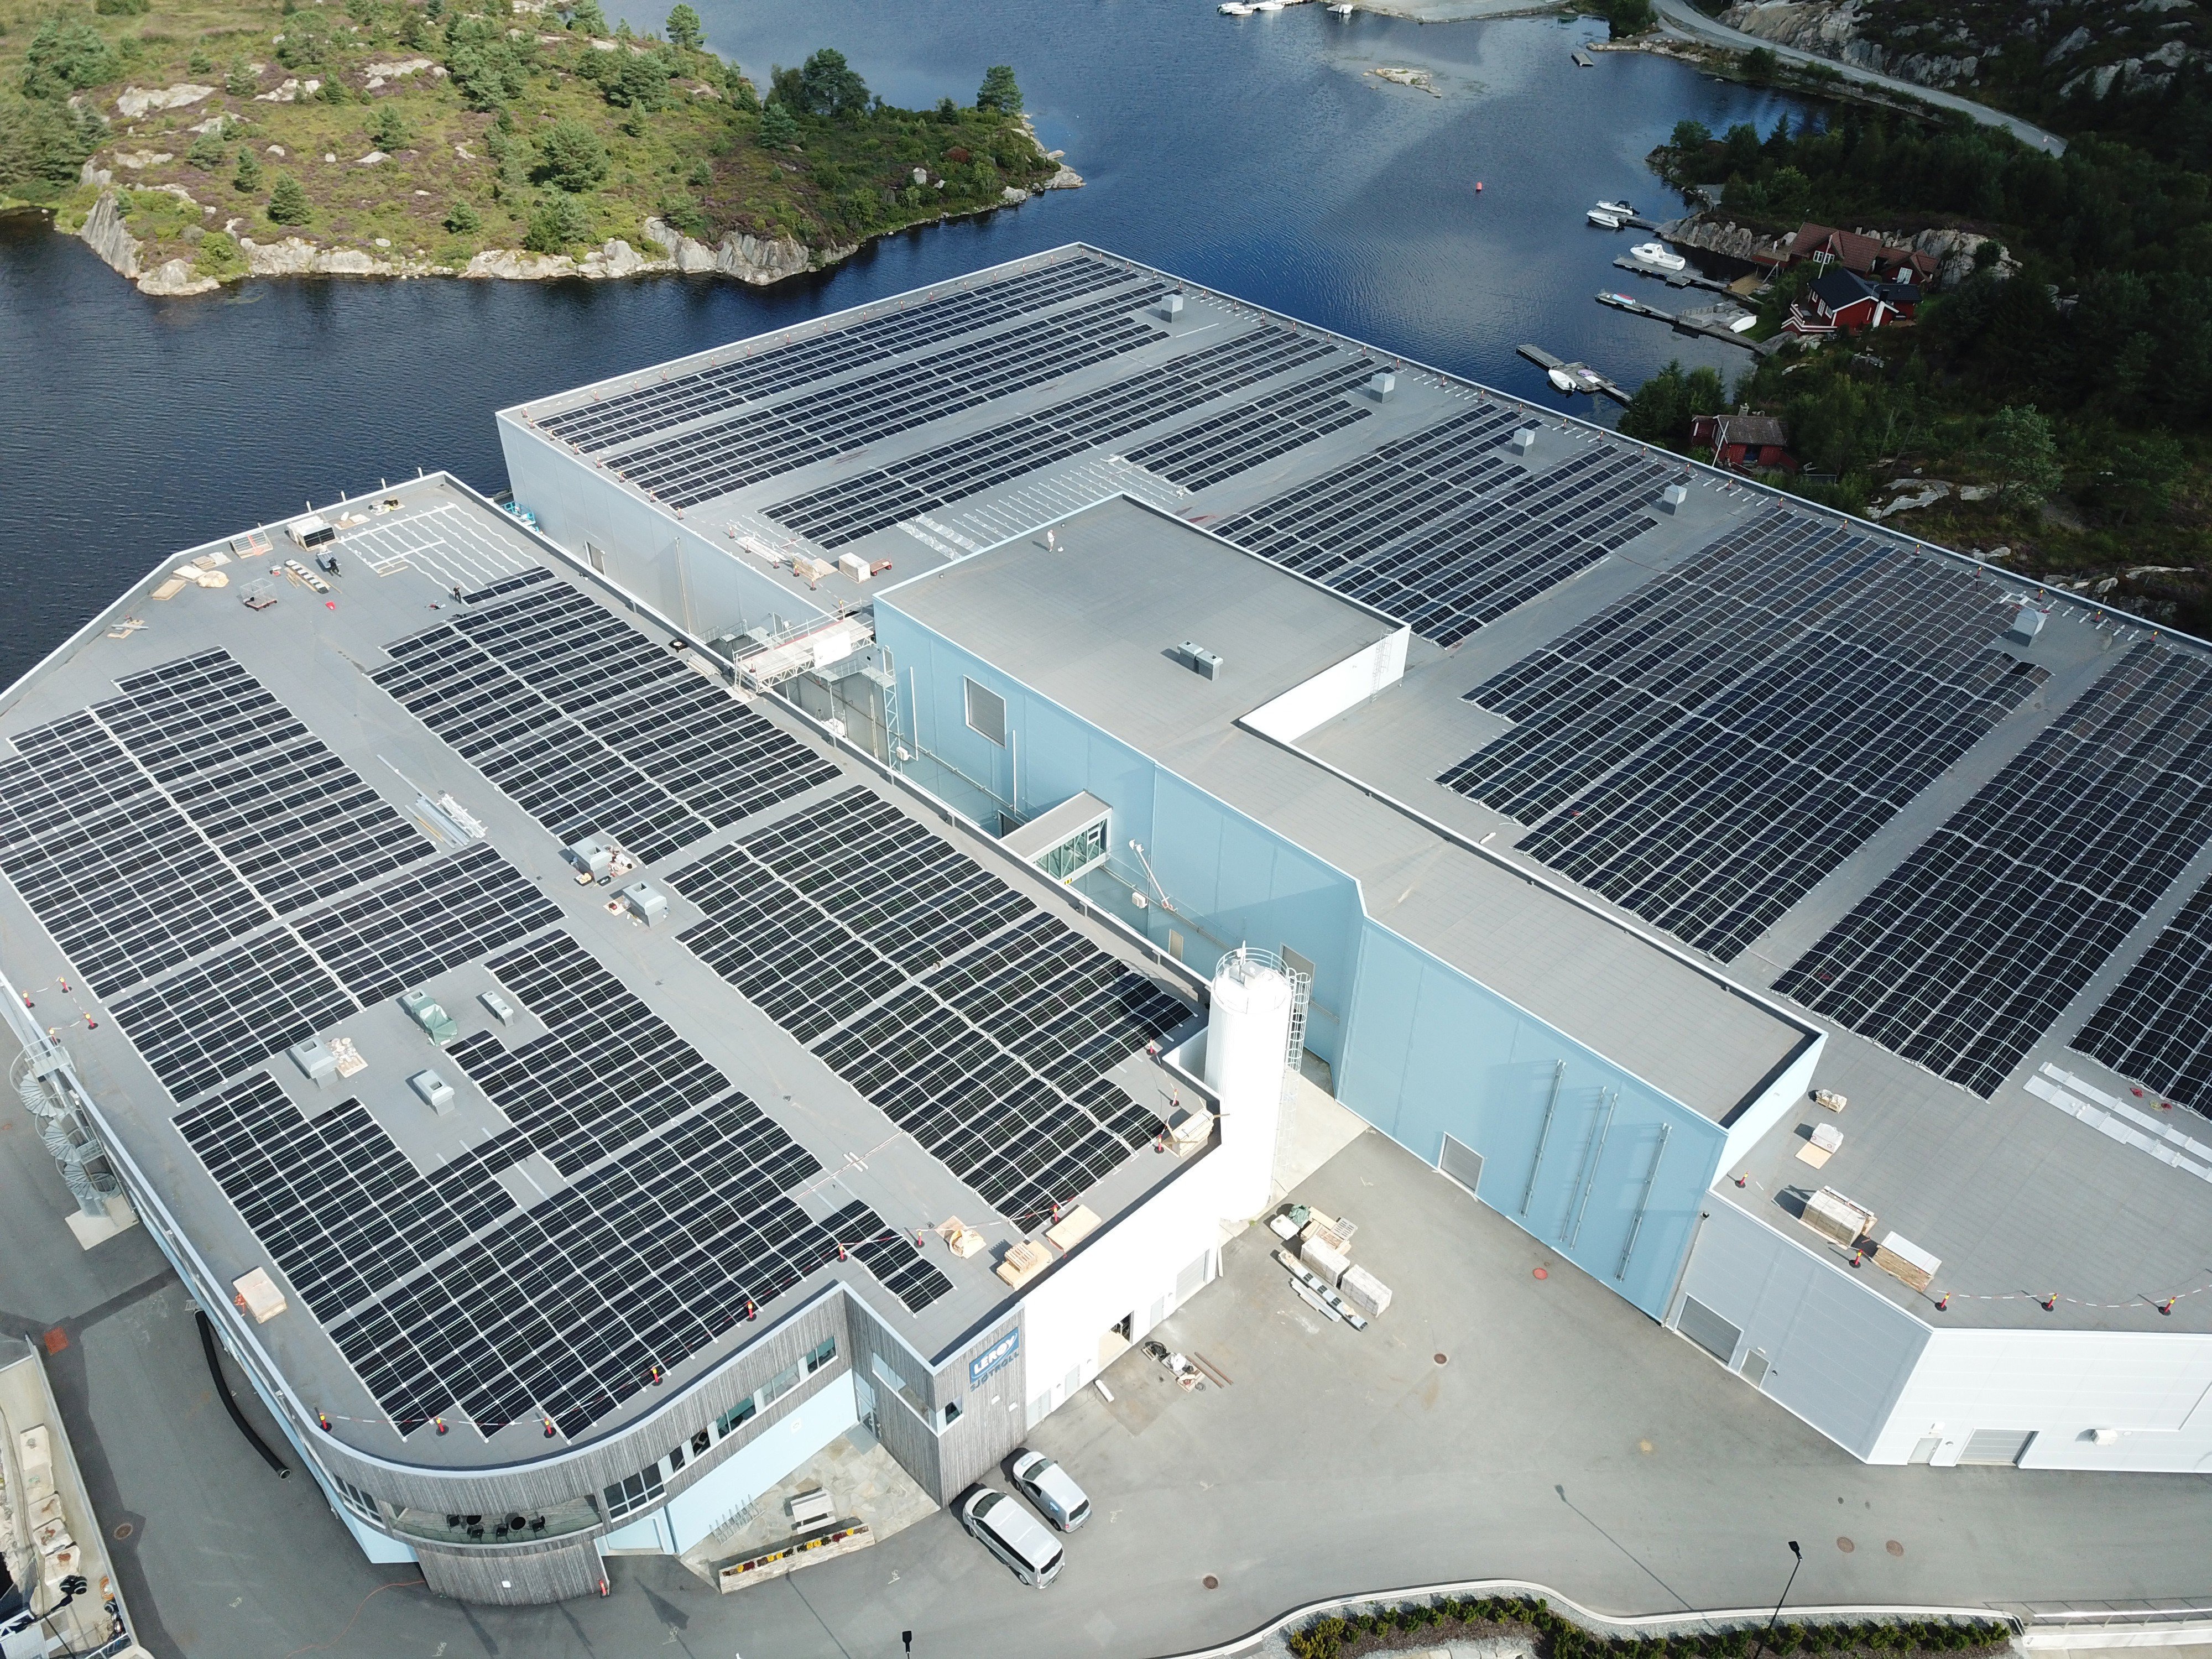
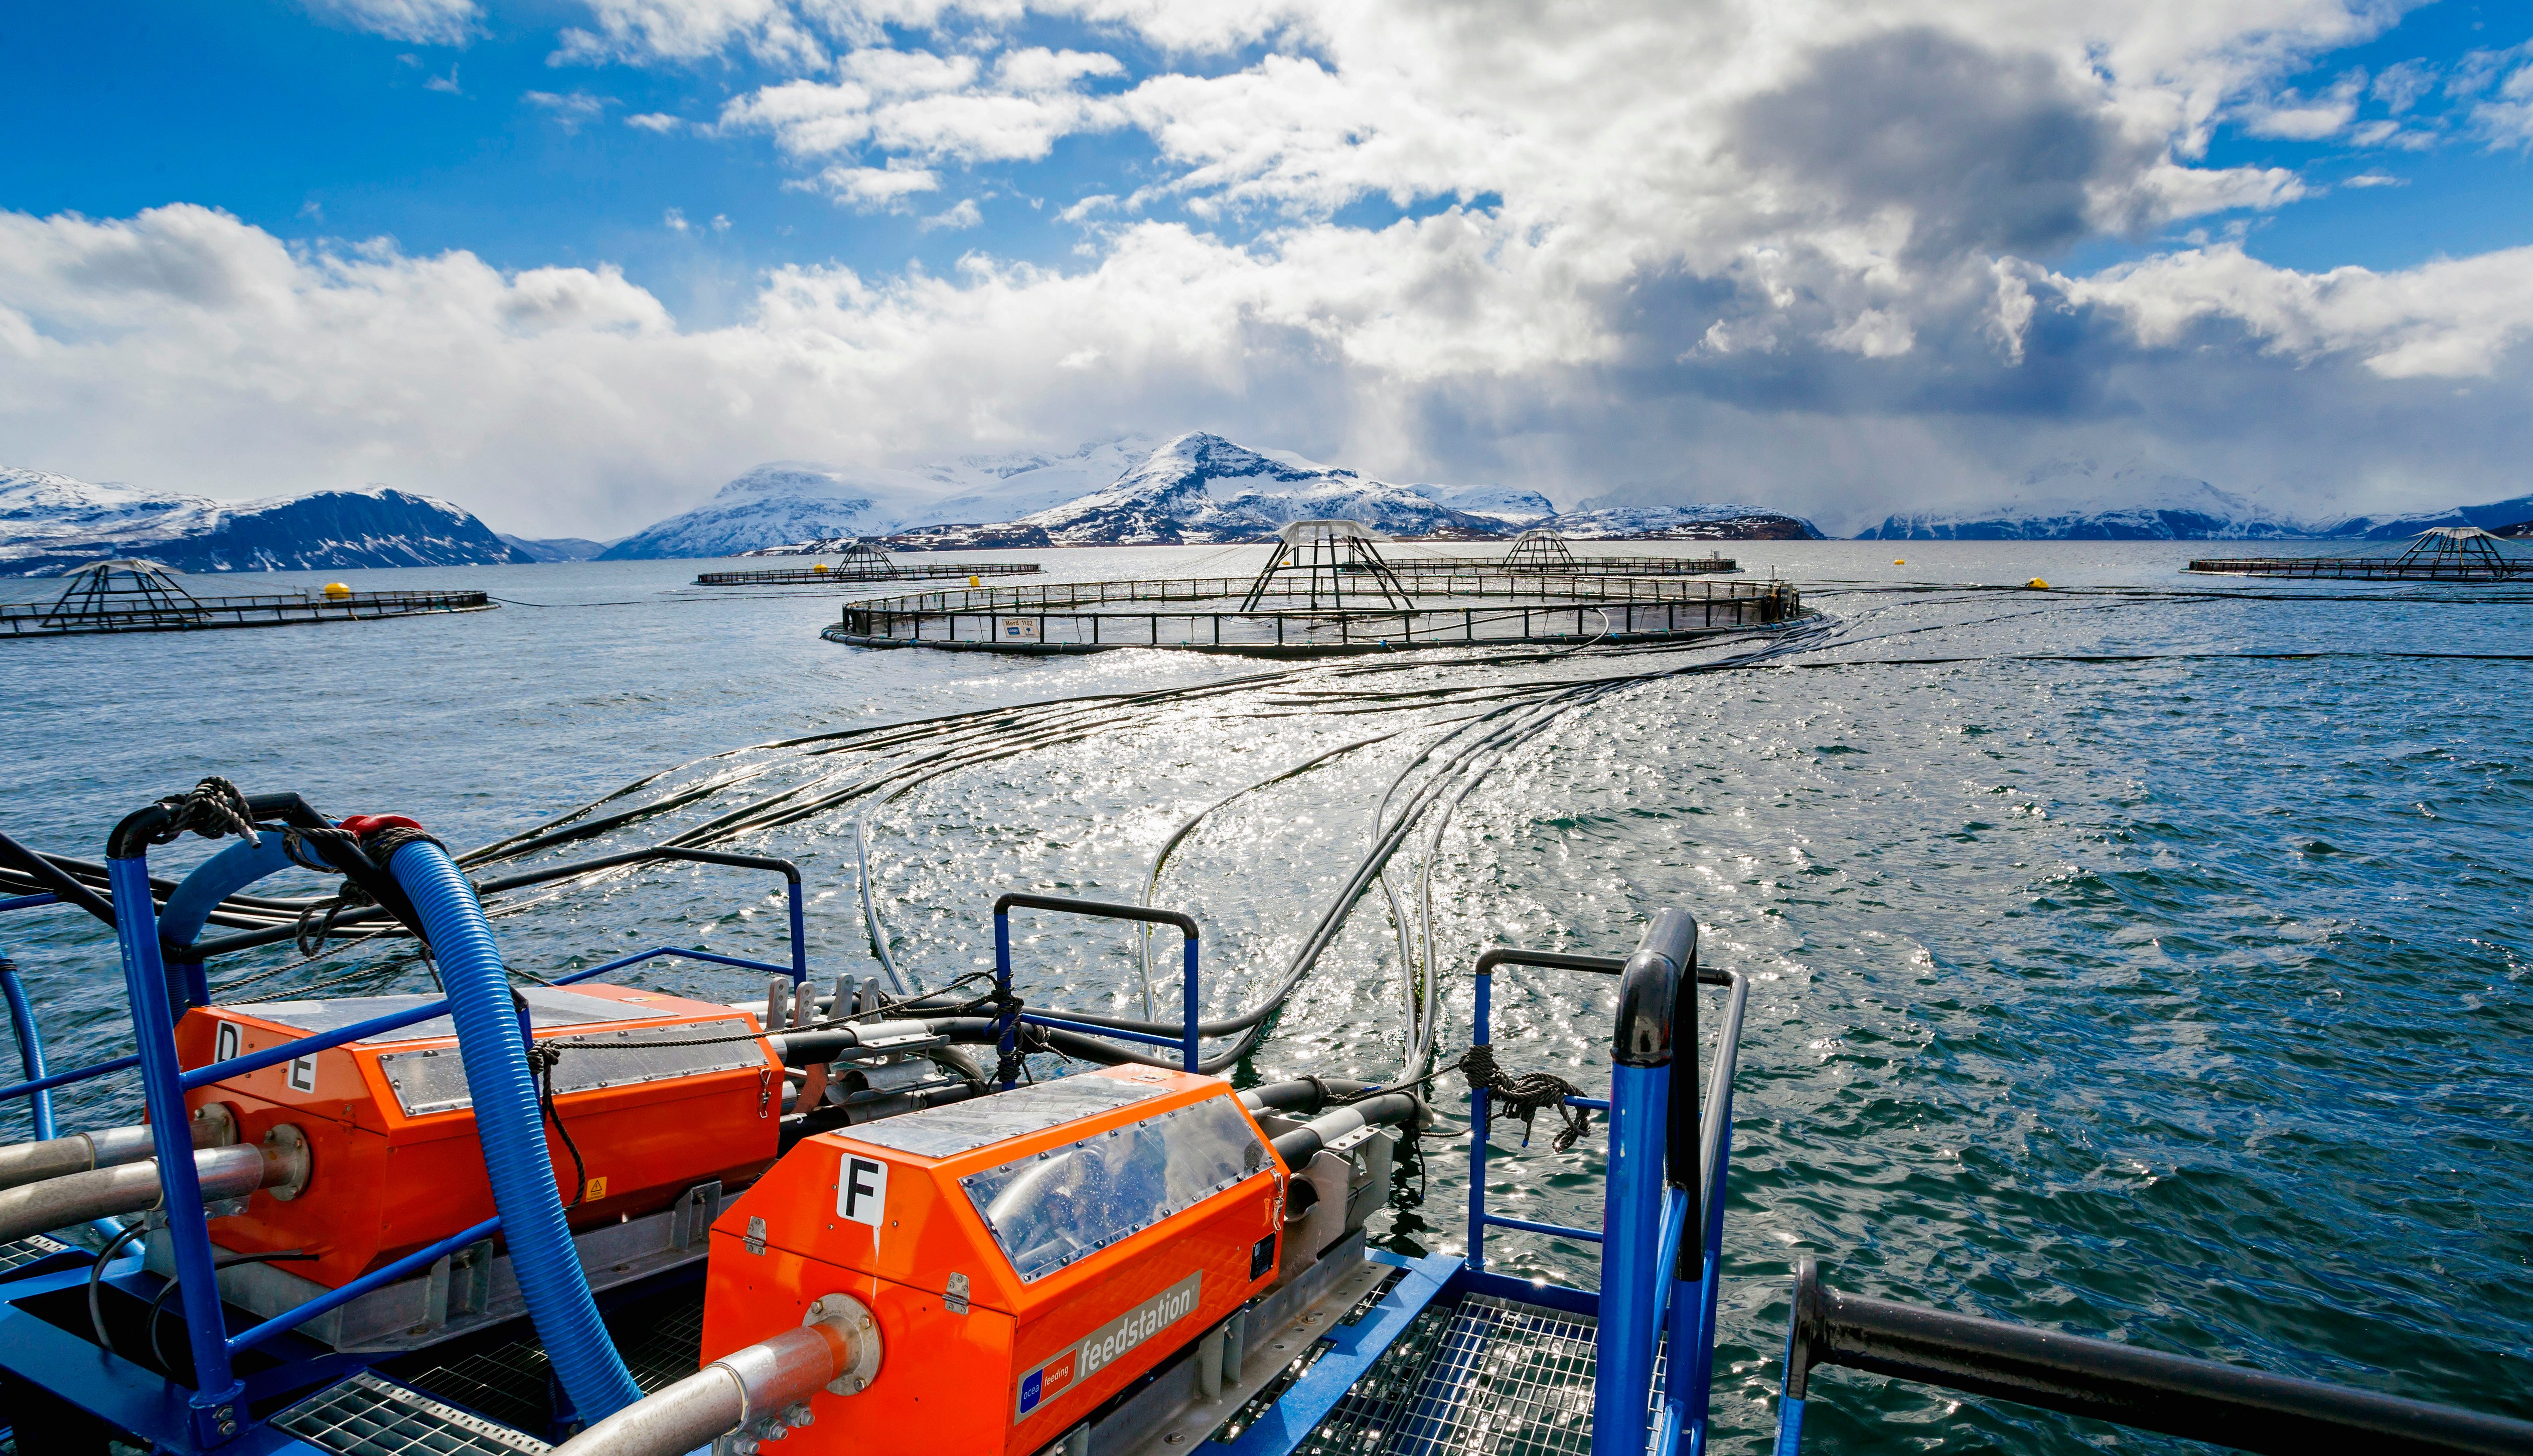
The Group has established different measures in order to reduce its environmental impact; from obtaining power from land, hybrid fleets, floating solar cells, to electric working boats.
Wherever it is possible, the Group seeks to use electricity sourced from land-based powerlines instead of electricity from generators at each production site.
Power from land usually makes good overall economic sense.
Power from land results in:
The further development of power from land should entail a degree of overcapacity, thus enabling electrified boats to be recharged.
More than 80 % of our sites now run on power from land, on remaining sites where the infrastructure is insufficient for land-based electricity, Lerøy Seafood Group is developing hybrid solutions that allow for up to 30% more efficient use of fossil fuels at each site.
The various measures require technological development and a high level of expertise, and in many ways, they represent a breakthrough in the industry.
Lerøy Kjærelva is a RAS (Recirculating Aquaculture Systems) facility, which means that 99% of the water is reused. Because little water resources are used, it is environmentally friendly and sustainable. The RAS technology still requires more electricity to purify the water used. This means that fish from RAS facilities have a higher energy footprint than fish traditional farming, however the solar panels contribute to a lower activity carbon footprint in total.