-
SEARCH
Type your search in the field above

Lerøy is continuously working on improving its monitoring and reporting of greenhouse gas emissions. Information regarding our greenhouse gas emissions is crucial for understanding and responding to environmental challenges as well as to being able to identify improvement opportunities.
In 2022 the Company carried out an extensive project which aimed to enhance Lerøy’s reporting processes and practices. The Group has strengthened its reporting routines, however we acknowledge that we need to focus on further improvement of quality of the reported data to ensure that the reporting is more accurate, complete and transparent.
A key change from previous year’s reporting is that a major part of well-boat and service boat activity (time chartered vessels) is moved from Scope 3 to Scope 1 reporting including operating leases (as defined by IFRS 16) in Scope 1 accounting (for more detailed information regarding operating leases, please, visit https://www.ifrs.org/). This change has a significant effect on Scope 1 reporting, resulting in 20% increase of Scope 1 emissions compared to 2021 levels. Emissions from well-boats and service boats represent approximately 22% of total Scope 1 emissions in 2022. Lerøy is aware of the effect that the changed and improved reporting practice has on the climate accounts and is planning on adjusting/ correcting its climate reports for previous years in order to improve the transparency, quality and comparability of the reported information. This major change in reporting will also be reflected in re-calculation of both base year (2019) emissions and Lerøy’s Science-Based Target. This process will commence in Q2 2023.
Lerøy has also established a closer cooperation with shipping companies that provide well-boat and service boat services and has worked on enabling the shipping companies to improve their procedures for gathering and reporting of relevant data as well as on strengthening reporting processes internally. A key takeaway from 2022 is that Lerøy needs to both intensify and strengthen its daily dialogue with these suppliers in order to secure better data flow and exchange.
The Group has completed a comprehensive analysis of climate related risks and opportunities which the Group is facing over short, medium and long term. The analysis has confirmed the importance of measuring, monitoring and reporting on our environmental performance. The analysis is discussed in greater detail in the Group’s Task Force Climate-Related Financial Disclosures (TCFD) report
A new TFCD report was released in Q2 2023.
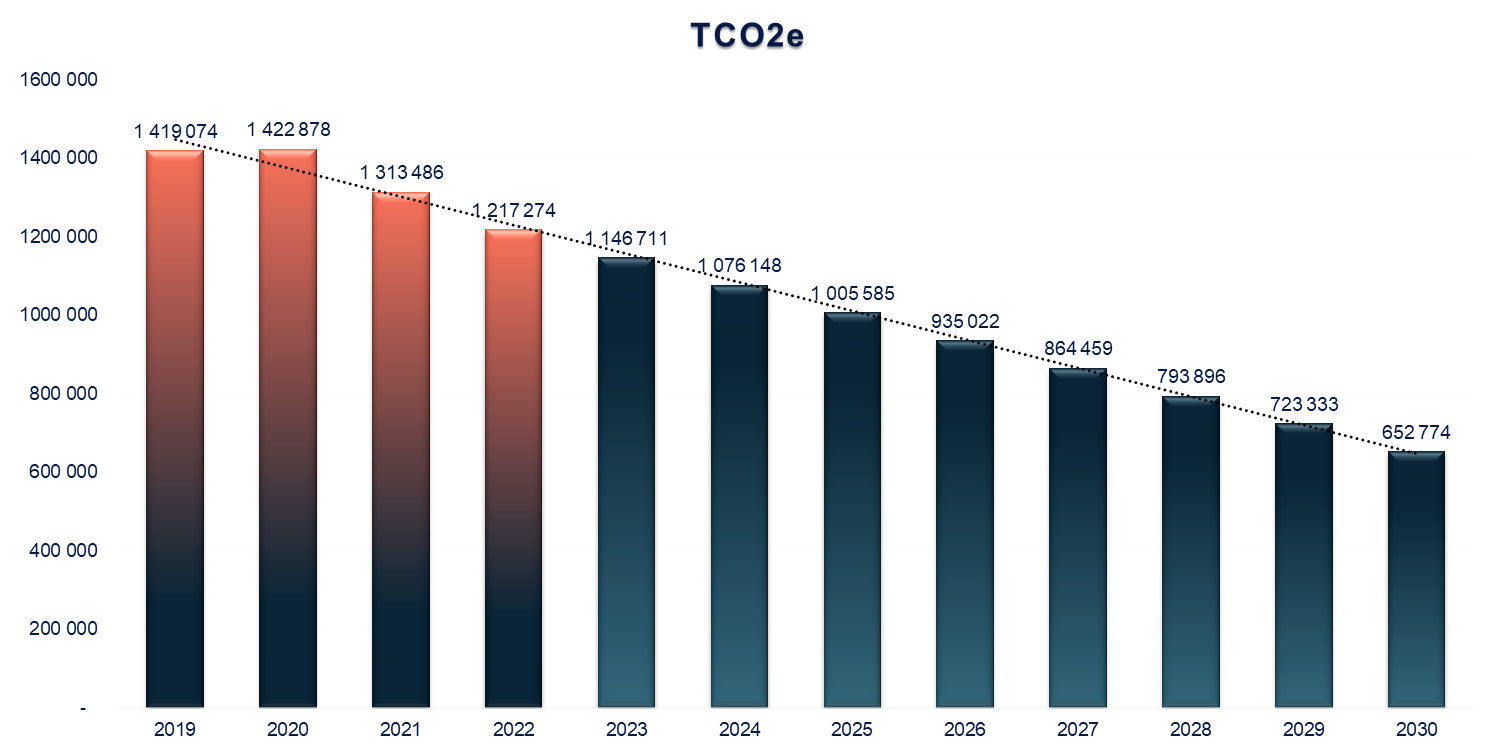
Lerøy has set ambitious science-based targets to reduce our carbon footprint: We aim to reduce our CO2e emissions by 46% by 2030 compared to 2019 levels. (ref: Climate Policy). Lerøy has defined 2019 as the base year for our science-based climate target as this was the first year all operating segments in the Group were conducting greenhouse gas emission reporting for Scope 1, 2 and 3. Lerøy has also committed to become climate neutral by 2050.
The reported emission figures have been collected throughout 2022 from relevant suppliers via invoices and are based on the same data sources as the figures reported in Lerøy’s 2021 annual report.
Lerøy’s greenhouse gas emissions are reported in accordance with the GHG Protocol Corporate Accounting and Reporting Standard. The Group uses the operational control approach for consolidating GHG emissions accounting. It means that emissions from operations, over which it has operational control, are included in Scope 1 and 2 reporting, however indirect upstream and downstream emissions relating to its operations are accounted for in Scope 3. Reporting units account for their use of fossil fuels, refrigerants, electricity, district heating/cooling, water usage, waste composition (incl. methods of waste disposal). Climate account statements are consolidated in the same manner as financial statements showing aggregated results for the Group’s entities (reporting units).
The Group’s Scope 3 emissions are reported in accordance with the GHG Protocol Corporate Accounting and Reporting Standard (Corporate Value Chain (Scope 3)). The Group has mapped its “carbon hotspots” and identified the main sources of greenhouse gas emissions which are included in the Group’s Scope 3 climate accounts. For more detailed information, please, see table Scope 3 Overview per Category below.
Emission factors
Emissions data for Scope 1, 2 and 3 covers reporting of the following greenhouse gases: carbon dioxide (CO2), methane (CH4), nitrous oxide (N2O), hydrofluorocarbons (HFCs) and perfluorocarbons (PFCs). The Group has not reported any biogenic CO2 emissions in Scope 1 or Scope 3 in 2022. We will hold off doing so until the methodology on how to calculate biogenic emissions will become more established.
Scope 1
Sources for Scope 1 emission factors used for calculation of tCO2e are DEFRA (Department for Environmental Food and Rural Affairs, UK Government), 2022, National Standard Emission Factors (Norwegian Environment Agency), 24th February 2015, Linde Gas (Industrial gasses) 2022, A-gas Product information guide, product information summary-refrigeration Library - refrigerants - A-gas product information guide, 2022.
Scope 2
There are two types of Scope 2 emissions: location based and market based. Location-based Scope 2 emissions are calculated based on the average emissions factor for the grid region where the organization consumes electricity. Marked-based Scope 2 emissions, on the other hand, take into account the specific contractual instruments that an organization has in place to purchase renewable energy certificates or power purchase agreements.
The source for location-based Scope 2 emission factors used for calculation of Lerøy’s Scope 2 CO2e is the International Energy Agency (IEA). The Nordic electricity mix factor is developed by Cemasys (sustainability consultancy company and service provider for registration and calculation of climate accounts) and covers the weighted production in Sweden, Norway, Finland and Denmark reflecting the common Nord Pool market area. The factors used are based on national gross electricity production mixes on a 2 year "lag". The Nordic electricity mix used to calculate the Group’s location-based Scope 2 emissions for 2022 are based on 2020 factors. The emission factors from IEA used in the location-based calculation of scope 2 emissions from electricity use are taken from the document “IEA Emission factors” published in 2022. Since 2020, Cemasys no longer uses a 3-year rolling average, but instead uses the annual figure (2 years "lag", example: the emission factor for 2021 is based on the figure for 2019. The datasets used are "CO2 emission factors for electricity only generation (CHP electricity included) for world countries (in CO2 per kWh)" and "CH4 and N2O emission factors for electricity generation (based on default IPCC factors) (in CO2eq per kWh)". This means that the emission factors include emissions of CO2, CH4 and N2O (converted into CO2e). Electricity trade has not been taken into account.
IEA:s explanations of the datasets:
“The emission factors are converted from gCH4 and gN2O to gCO2eq using the 100-year Global Warming Potential (GWP). For the purpose of comparability with international data submission guidelines, the factors from the 4th Assessment of the IPCC are used. 1gCH4 = 25 gCO2eq”
The Group has purchased Guarantees of Origin (GOs) in 2022. Information regarding companies which have purchased GOs as well as the percentage share that covers the consumption is reported in Cemasys (the Group’s internal reporting system for GHG emissions accounting).
Regarding market-based emissions – the choice of emission factor using this method is determined by whether the business acquires Guarantees of Origin or not. For electricity without the GOs, the emission factor is based on the remaining electricity production after all GOs for renewable energy are sold. This is residual mix, which is normally substantially higher than the location-based factor.
Sources for Scope 3 emission factors used for calculation of tCO2e are DEFRA (Department for Environmental Food and Rural Affairs, UK Government) 2022, Greenhouse gas emissions of Norwegian seafood products in 2017, SINTEF study, Emission factors from fish feed producers 2022, Database Ecoinvent 3.8 (2022) as well as supplier specific emission factors.
Info: Expand table for more details
| Category | tCO2e | |
|---|---|---|
Purchased goods and services
|
||
Capital goods
Information regarding used construction materials (concrete and steel used in supplementary construction of Belsvik facility (Lerøy Midt). Belsvik facility is a hatchery-produced (on-growing) fish facility. The facility was extended with a post smolt facility in 2022. |
||
Fuel and energy related activities
Well to Tank (WTT)**. Calculations based on the existing consumption data volumes collected from the Group’s companies throughout the year. The calculation is based on the reported consumption data for Scope 1 and 2 (for more detailed information, see table Total Consumption of Fossil Fuels (Scope 1). |
||
Upstream transportation and distribution (outbound transportation)
Transportation services (sea transportation, service boats, well boats***). Consumption data collected from sea transportation/ well- boat service providers (calculations include WTT). Transportation of produced products to customers. Information collected from the Group’s Logistics department. The calculations are based on distance from capital to capital. The emission factors used are determined by type of transportation mode. |
||
Waste generated in operations
Waste - data on waste volumes, waste composition (incl. methods of waste disposal) is collected from the Group’s companies throughout the year. |
||
Business travel
Air travel (business travel by air) - information regarding distances traveled is collected from travel agent the Group uses (including WTT). |
||
Employee commuting
Employee commuting – estimation based on SSB (Statistisk Sentralbyrå) for Norwegian operations, TRAFA (Transport Analysis) for Swedish operations, and STATISTA for operations in the Netherlands. For all other operations - INSEE statistics as well as official government websites are used. |
||
Upstream leased assets
N/A |
||
Downstream transportation and distribution
Downstream transportation and distribution - transportation of products carried out by the customers themselves. Information collected from the Group’s Logistics department. The calculations are based on distance from capital to capital. The emission factors used are determined by the mode of transportation. |
||
Processing of sold products
Processing of sold products – calculations consist of two parts – part one - estimated use of electricity for storage of fish in the country of consumption before the product is sold to end consumer. Part two – estimated emissions related to third party processing. |
||
Use of sold products
N/A |
||
End-of-life treatment of sold products
End of life treatment – organic waste estimated share (%) of non-edible fish. |
||
Downstream leased assets
N/A |
||
Franchises
N/A |
||
Investments
N/A |
||
*For more detailed information regarding the categories, please visit Corporate Value Chain (Scope 3) Accounting standard
**A Well-to-Tank emissions factor, also known as upstream or indirect emissions, is an average of all the GHG emissions released into the atmosphere from the production, processing and delivery of a fuel or energy vector.
*** Well-boats and service boats which are not classified as operating leases (ref. definition IFRS 16) are included in Scope 3 emissions since Lerøy does not have operational control over the leased assets held under an operating lease.
| Fossil fuels and electricity | Unit | 2018 | 2019 | 2020 | 2021 | 2022 | |||||||||||||||||||||
|---|---|---|---|---|---|---|---|---|---|---|---|---|---|---|---|---|---|---|---|---|---|---|---|---|---|---|---|
Diesel*
|
|||||||||||||||||||||||||||
Marine gas oil (MGO)
|
|||||||||||||||||||||||||||
Petrol**
|
|||||||||||||||||||||||||||
Biodiesel fuel (HVO)
|
|||||||||||||||||||||||||||
LPG (Propane)
|
|||||||||||||||||||||||||||
Natural gas
|
|||||||||||||||||||||||||||
LPG (Propane)
|
|||||||||||||||||||||||||||
Fuel oil
|
|||||||||||||||||||||||||||
Refrigerants
|
|||||||||||||||||||||||||||
*Diesel includes Diesel (100% fossil), Diesel (B7) and Diesel (B30 HVO)
**Petrol includes Petrol (100% fossil) and Petrol (E5)
NB! Scope 3 emissions are not included in the GHG emissions intensity ratio calculation, however Scope 3 is a significant contributor to GHG emission intensity. The Group is working on improving its reporting routines to be able to allocate Scope 3 emissions to the respective segments in the Group.
| Unit | 2018 | 2019 | 2020 | 2021 | 2022 | ||||||||||||||||||||||
|---|---|---|---|---|---|---|---|---|---|---|---|---|---|---|---|---|---|---|---|---|---|---|---|---|---|---|---|
Group
|
|||||||||||||||||||||||||||
| Unit | 2018 | 2019 | 2020 | 2021 | 2022 | ||||||||||||||||||||||
|---|---|---|---|---|---|---|---|---|---|---|---|---|---|---|---|---|---|---|---|---|---|---|---|---|---|---|---|
Farming
|
|||||||||||||||||||||||||||
Wildcatch
|
|||||||||||||||||||||||||||
VAP, Sales & Distribution
|
|||||||||||||||||||||||||||
Group
|
|||||||||||||||||||||||||||
Annual Scope 2 Market-based GHG emissions:
|
|||||||||||||||||||||||||||
CO2e emissions for fish are in general low. When compared with other types of proteins we eat, salmon has the lowest eco-footprint.
Scope 1 emissions have increased by 20% compared to 2021 levels. The reason for the change is amended reporting practices (ref. chapter Emissions 2022 in Sustainability library) as well as improved quality of data.
Scope 2 emissions have decreased by 6,8% compared to 2021 levels due to use of cleaner sources of energy.
Scope 3 emissions have decreased by 10,26% due to significant decrease in emissions from fish feed as well as moving well and service boat emissions to Scope 1 (ref. chapter Emissions 2022 in Sustainability library).
In 2022 total GHG emissions for Lerøy Seafood Group (Scope 1,2 and3) have decreased by 7% compared to 2021 levels.
TOTAL CONSUMPTION OF FOSSIL FUELS (SCOPE 1)
| Unit | 2018 | 2019 | 2020 | 2021 | 2022 | |
| Farming | ||||||
| Diesel* | liter | 2 262 514 | 2 591 190 | 2 654 552 | 2 893 492 | 6 264 465 |
| Marin gas oil (MGO) | liter | 3 540 849 | 3 656 064 | 3 525 430 | 3 461 428 | 12 994 859 |
| Petrol** | liter | 189 287 | 264 596 | 414 031 | 471 823 | 558 852 |
| Biodiesel fuel (HVO) | liter | - | - | - | - | - |
| LPG (Propane) | kg | - | - | - | - | - |
| Fuel oil | liter | 26 202 | 84 271 | 206 904 | 45 916 | 661 |
| Refrigerants | kg | 228 | 1 670 | 478 | 379 | 140 |
| Wildcatch | ||||||
| Diesel* | liter | 3 192 | 9 781 | 8 033 | 10 789 | 7 927 |
| Marin gass olje (MGO) | liter | 36 538 544 | 35 559 152 | 38 723 297 | 43 309 534 | 40 341 435 |
| LPG (Propane) | kg | 1502 | 211 | 780 | 2 013 | 704 |
| LPG (Propane) | liter | - | 203 | 1 136 | - | - |
| Petrol** | kg | - | - | 503 | 486 | 169 |
| Refrigerants | kg | 504 | - | - | - | 677 |
| VAP, Sales & Distribution | ||||||
| Diesel* | liter | 196 923 | 558 697 | 404 058 | 476 053 | 600 168 |
| Petrol** | liter | 25 154 | 24 260 | 28 087 | 44 521 | 107 091 |
| Natural gas | m3 | 18 620 | 24 266 | 78 553 | 189 628 | 478 537 |
| LPG (Propane) | kg | 957 | 50 935 | 53 825 | 36 588 | 79 842 |
| LPG (Propane) | liter | - | - | 132 | - | - |
| Fuel oil | liter | 19 254 | 17 525 | 18 051 | 21 795 | - |
| Refrigerants | kg | 74 | 3 | 93 | 1 680 | 5 578 |
| Group | ||||||
| Diesel* | liter | 2 462 629 | 3 159 669 | 3 066 643 | 3 380 334 | 6 872 560 |
| Marin gass olje (MGO) | liter | 40 079 393 | 39 183 756 | 42 248 727 | 46 770 962 | 53 336 294 |
| Petrol** | liter | 214 441 | 288 856 | 442 621 | 516 830 | 666 111 |
| Biodiesel fuel (HVO) | liter | - | - | - | - | - |
| Natural gas | m3 | 18620 | 24 266 | 78 553 | 189 628 | 478 537 |
| LPG (Propane) | kg | 2459 | 51 146 | 54 605 | 38 601 | 80 546 |
| LPG (Propane) | liter | - | 203 | 1 268 | - | - |
| Fuel oil | liter | 45 456 | 101 796 | 224 955 | 67 711 | 661 |
| Refrigerants | kg | 806 | 1 673 | 571 | 2 059 | 6 395 |
*Diesel includes Diesel (100% fossil), Diesel (B7) and Diesel (B30 HVO)
**Petrol includes Petrol (100% fossil) and Petrol (E5)