-
SEARCH
Type your search in the field above

Management and responsibility for freshwater withdrawals, waste water treatment and discharge are located locally in each company in the Group. The overall responsibility to form policies, establish KPI`s and strategies for our withdrawals, treatment and discharge of water lies with the Group management. In addition the Group have a responsibility to consolidate, and control reported water related data from all companies.
All Water withdrawal per source, and discharge per treatment type and destination are reported monthly through Cemasys (Cemasys.com). LSG have developed Apps in PowerBI to monitor, control and analyse all environmental data reported through Cemasys. Based on these tools our companies are better equipped to control their environmental accounting, see trends and implement preventive actions to mitigate negative impacts, and potensially increase possible postive impacts. In addition we can monitor if our actions have the desired effect. Actual and potential impacts, both positive and negative from our operations have been identified through Risk evaluations.
We have identified that our operations do not have any significant impact on water bodies which we have permits for water withdrawal and discharge water quality. There are some potential negative impacts of our operations. If we withdraw significantly more water over time than we are allowed to, it can in worst case cause irreprable damage to local flora and fauna in the area. This will in turn impact our operations, potensially leading to reduced capasity, employment and downstream activities. Our most water intensive operation do not withdraw water from drinking water sources.
LSG report in accordance with guidelines from several third party benchmarking organizations and stakeholders (Coller FAIIR, CDP and GRI). In 2022 LSG extended the risk assessment regarding water withdrawal, water discharge and consumption of freshwater for all locations in the group, using WRI Aquaduct (https://www.wri.org/aqueduct) as a tool to identify which of our operations are located in areas with medium to high risk of Water Stress and Water Depletion.
Locations identified as being at risk for Water Stress and/or Water Depletion (See table 4 below) are in a continuous process of monitoring their local impacts, form action plans and frameworks where needed. Where policies are established on a national level, companies in the group have been informed and are in dialogue with official representatives. This is an ongoing process which have generated actions to reduce water withdrawal and improve water treatment of discharged water (See table 5 below).
Each location is tracking their progress using our PowerBI solution. 2022 is the first year we have a complete dataset for all locations regarding Water withdrawal, water discharge and consumtion of water. Going forward we can Track effectivenes of actions taken on a monthly basis and form Targets based on 2022 as baseyear.
Since our operations in large does not consume water, we have shifted our target for 2023 to only include locations in medium to high risk of water stress. Our new target is to reduce our water withdrawal in areas with medium to High risk of water stress with 5 % within 2025, with baseyear 2022. Locations included in this target can be found in table 4.
LSG are committed to ensure that all our employees have their basic needs regarding fresh water available in all our operations. This includes their right to access to clean quality fresh drinking water, sanitation facilities and clean working clothes. There have been no whistleblowing cases related this topic in 2022.
The Group have not registered any violations of regulations related to use of -and discharge of water in 2022.
Fresh water related data have been audited by third party.
Lerøy do not have any feed farming operations.
More information can be found in our LSG Water withdrawal and waste water discharge Policy.

CapEx in 2022 includes investments in RAS technology, water saving equipment, waste water purifying facilities and technology and Water efficiency equipment. OpEx in 2022 include cost related to water permits, water use cost, Waste water treatment cost and labour cost. Lerøy aquired several new companies and facilities in 2022 which explains the increased OpEx. The drop in CapEx is related to no new investments in RAS facilities i 2022.
Table 1: Water related CapEx and OpEx:
|
|
2021 |
2022 |
|
CapEx |
125 831 647 NOK |
105 003 702 NOK |
|
OpEx |
12 551 294 NOK |
23 447 573 NOK |
The worlds dependency on clean freshwater have never been greater. With an increasing global population, increased temperatures due to increased Co2 emissions and increased pollution, it has become even more important to govern our water sources in a sustainable manner.
LSG take this responsibility seriously and strive to protect and safeguard the freshwater sources we draw water from. We have devised strict protocols and procedures to make sure that we do not draw on more water than we are allowed to.
We are also in dialogue with local stakeholders and communities thorough local meetings organized by Lerøy. We need, through our ASC certification, to have meetings with local stakeholders and communities to discuss concerns and questions they have. To this date water withdrawal, water discharge and consummation of water have not been a topic at any of these meetings. We have neither had any enquiries or questions asked regarding our water management from Stakeholders.
We also continue our effort to switch all flow through systems for Salmon farming over to RAS and invest in water saving equipment in our downstream operations (See table 1).
Table 2: Overview water withdrawal, discharged water and Water withdrawal per kg produced LSG 2021 and 2022 with % change
|
|
2021 (m3/megaliter) |
2022 (m3/megaliter) |
% change |
|
Water withdrawal Total |
85 115 627,7 / 85 115,6 |
96 775 397/ 96 775,3 |
13,7 |
|
Water Discharged Total |
NA* |
96 630 139 / 96 630,1 |
NA |
|
Water withdrawal per kg produced* |
NA |
0,26** |
NA |
*Incomplete dataset for 2021
**excluding farming operations (Farming, Smolt production, cleanerfish production and parentfish production)
Our water withdrawals have increased with 13,7 % in 2022 compared to 2021. Our smolt production operations contribute to a significant part of all the increase. We also see a decrease in some processing facilities, while an increase in the total volume water withdrawn for our VAP Sales and Distribution segment. Below is listed main reasons for the increase, and decrease in water withdrawal:
Table 3: Water withdrawal per source in m3 (2022)
|
Water Source |
m3 / megaliter |
% of total Water withdrawn |
|
Surface |
94 774 713 / 94 774,7 |
97,932 |
|
Municipal |
1 992 611 / 1 992,6 |
2,059 |
|
Groundwater |
8 072 / 8,0 |
0,008 |
The farming segment used 0,36 m3 fresh water per kg fish produced, while our slaughterhouses used 0,0093 m3 freshwater per kg fish produced, and our VAP segment used 0,0058 m3 in 2022. Wildcatch segment used 0,0052 m3 per kg fish produced. This signifies a reduction for all segments compared to 2021.
 = Municipal
 = Sea
-
-
43,58
[2]
-
5,98
-
-
-
-
-
19,73
-
-
-
4,26
-
-
-
5,6
-
-
-
37,82
-
18,4
-
-
-
13,11
-
-
-
-
-
-
-
11 864
-
0,17
-
-
-
-
-
-
-
35,36
-
-
-
50,82
-
-
-
24,93
-
-
-
28,21
-
-
-
11,41
-
-
-
-
-
5,93
-
-
-
5,93
-
-
-
63,86
-
-
-
5,04
-
-
-
12,69
-
-
-
4,37
-
-
-
4,01
-
-
-
4,34
-
-
-
-
-
3,32
-
3,4
-
-
-
31,04
-
-
-
6,58
-
1,67
-
70
-
-
-
0,75
-
-
-
37,94
-
-
-
310,85
-
267,89
-
-
58 638
-
36 124,85
-
830,37
-
-
-
87,76
171,59
198,67
310,85
89,56
43,97
36 323,52
111,9
-
67,6
-
= Sea
-
-
43,58
[2]
-
5,98
-
-
-
-
-
19,73
-
-
-
4,26
-
-
-
5,6
-
-
-
37,82
-
18,4
-
-
-
13,11
-
-
-
-
-
-
-
11 864
-
0,17
-
-
-
-
-
-
-
35,36
-
-
-
50,82
-
-
-
24,93
-
-
-
28,21
-
-
-
11,41
-
-
-
-
-
5,93
-
-
-
5,93
-
-
-
63,86
-
-
-
5,04
-
-
-
12,69
-
-
-
4,37
-
-
-
4,01
-
-
-
4,34
-
-
-
-
-
3,32
-
3,4
-
-
-
31,04
-
-
-
6,58
-
1,67
-
70
-
-
-
0,75
-
-
-
37,94
-
-
-
310,85
-
267,89
-
-
58 638
-
36 124,85
-
830,37
-
-
-
87,76
171,59
198,67
310,85
89,56
43,97
36 323,52
111,9
-
67,6
-
In our operations, and mainly the Smolt operations, there have been identified risks which may have a negative impact on our operations. Long term drought has the highest consequences for our operations and may cause severe impacts on both fish welfare and economics. Long term drought which will deplete our water reserves in magazines is however deemed unlikely since access to clean high quality freshwater in Norway is good. Lerøy only produce protein in Norway where water sources is low risk of water stress. 0 % of revenue is therefore dependent on protein from water- stressed areas. In addition we have long term permits and agreements for water withdrawal from Water sources which mitigates some of the Risk of water shortages.
In addition, all processing factories located in areas with medium to risk of Water stress (See table 4), there can be risk associated with access to clean freshwater. To date no such problems have been reported, but we are planning for the eventuality that it may become an issue.
Our Downstream units are mainly located in industrial zones. These zones have both heavy and low water intensive industry. Our operations and withdrawal of water in these zones are considered as low compared to the other industries. Our business could however be influenced if water shortages and or regulatory changes divert water permissions to high intensive industries in periods of shortages. This has not occurred, and we se it as unlikely to influence our operations.
The RAS (Recirculating Aquaculture Systems) technology allows Lerøy Seafood Group to produce fish with up to 99% reduction in water use compared to conventional flow-through systems. The Group started to use RAS-technology already in 2005.
In 2022, approximately 80% of all salmon smolt in Lerøy Seafood Group was reared with this technology. RAS technology also entails that we recycle and cleans the water before discharge. In 2022 the total volume of freshwater which was recycled and reused in RAS systems was approximately 76 537 628 m3. That is 78 % of the total withdrawn water in the group.
Tabell 5: List of water saving and quality initiatives in companies with locations in medium to High risk of water stress (WRI Aquaduct)
|
Selskap |
Actions: water withdrawal reduction |
Actions: Water Discharge Quality |
|
Lerøy Turkey |
Changed Water spraying Nosils on fillet line to water saving types (2021) |
New on site waste water Treatment technology |
|
Lerøy France |
1) Changed cooling of Traysealers to Closed Circle 2) Maintenance/repaired Machines leaking water 3)New sealpack machine (Reduces water used to 8L/m maximum) |
|
|
Lerøy Spain |
1) Water saving nosils installed in the Madrid Factory. |
Water treatment plant installed 2022 in factory Madrid |
|
Lerøy Seafood Holding BV |
1)Changed several nosils on production lines to water saving types (2022) 2)Sensors on pinbone machine to drain water only when necessary.
|
|
|
Lerøy Portugal |
|
|
Units which are not in water stress areas have also implemented water reducing initatives and water quality improvements during 2022. This will, in addtion to improve our impact one the environment, also improve food safety and finances.
We continue our work with water treatment and discharge data. During 2022 we have established new procedures and guidelines for reporting of water discharge data. We have included in the reporting the subtracting of Ice -and Brine production from the total waste water discharge figures. This way we are able to calculate our consumed water. From 2023 we will also include water evaporation from Rice cooking in our Sushi production.
Our Target is that all facilities in Lerøy comply with National regulations and discharge limits in the country of operations. Discharge of waste water directly to freshwater environments we follow as a minimum the World Banks standard for waste limits where applicable to the specific geography. This included limits for Chemical Oxygen Demand (COD), Biological Oxygen Demand (BOD), Total Nitrogen (TN) and Total Phosphorus (TP). Lerøy had no discharge of wastewater to freshwater environments in 2022.
All of our processing factories, new and old, are equipped with fat separators and UV light treatment. In some factories, where it’s necessary, we also have chemical treatment (Chlorine) of waste water in addition to mechanical treatment before discharge.
See table 4 for discharge volumes per segment, and factories in areas with medium to high water stress risks.
The group had no water related incidents or accidents related to water withdrawal and water discharge (volume and quality) in 2022.
Discharge water is analysed and tested in accordance with local regulations/requirements or permits (See tables 6-9), and deviations is handled in our quality management system. For our operations in Norway we report all water data (volume withdrawn, discharge and quality) to local government.
Depending on location and local requirements parameters analysed can be TOC (Total Organic Carbon), Ntot (Total Nitrogen, NT) and Ptot (total phosphor, TP) for Juvenile fish production, or Biological oxygen demand (BOD), Chemical oxygen demand (COD) fats and solids for factories. The limit, or degree purified water for these can wary depending on permit, regulations and area of operations. The permits also describes which type of analyse must be done within each Limit (Phosphorus in ml/l, Nitrogen in ml/l, fat in mg/l, COD and BOD and Total Settled solids (TSS) in ml/l).
Nitrogen loading rate for farming operations is calculated based on the formula below:
((Factor number Nitrogen feed per kg * Kg feed put into sea)) – ((Factor number Nitrogen fish per kg * Kg fish taken up from sea)) /1000
((0,061 231 837 023)) - ((0,003264 * 182 215 000)) = 8195
Phosphorus loading rate for farming operations is calculated based on the formula below:
((Factor number Phosphorus feed per kg * Kg feed put into sea)) – ((Factor number Phosphorus fish per kg * Kg fish taken up from sea)) /1000
((0,008 231 837 023)) - ((0,002 * 182 215 000)) = 1490
All our processing facilities discharged wastewater to third party treatment plants which purify the water in accordance with local regulatory limits before released to water source. Lerøy have no discharge of wastewater directly to freshwater sources.
Using the WRI Aqueduct tool (Physical risk Quality) we performed in 2022 a risk assessment identifying 4 facilities operating in areas with low-medium and medium to high risk. Three are located in low to medium risk (Lerøy Italy Srl, Lerøy Smøgen Seafood AB and Lerøy Kungelv AB (Sweden)) and one in a medium to high risk area (Lerøy Turkey). We have invested in a new waste water treatment facility in Lerøy Turkey, see table 5. Lerøy Kungelv AB is a new facility opening in May 2022 and is equipped with new wastewater treatment systems. Lerøy Smøgen Seafood AB sends all its wastewater to a Biogas production facility.
Below are tables showing examples of regulatory limits for operations in areas with low and medium to high risk of water stress.
Table 6: Discharge limits for a Juvenil fish production location in LSG 2022. Low risk of water stress.
|
Source |
Component |
Degree of purification |
|
Wastewater |
Total Organic Carbon (TOC) |
77% |
|
Wastewater |
Total Nitrogen (Ntot) |
22% |
|
Wastewater |
Total phosphor (Ptot) |
64 % |
Table 7: Discharge limits for Lerøy Turkey (VAPS&D segment). High risk of water stress
|
Source |
Component |
Degree of purification |
|
Wastewater |
Settled Solids (SM 2540 F) |
10 ml/l |
|
Wastewater |
Chemical Oxygen Demand (SM 52220 D) |
800 mg/l |
|
Wastewater |
Oil and Grease (SM 5520 D) |
50 mg/l |
Table 8: Discharge limits for Lerøy France – Fishcut factory (VAPS&D segment) High risk of water stress
|
Source |
Component |
Degree of purification |
|
Wastewater |
Chemical Oxygen Demand (NFT 90-101) |
2000 mg/l |
|
Wastewater |
suspended matter (NFT 90-105) |
600 mg/l |
|
Wastewater |
biochemical demand in oxygen 5days (NFT 90-103) |
800 mg/l |
|
Wastewater |
Nitrogen content (EN 25663) |
150 mg/l |
|
Wastewater |
phosphorus content (NF EN 1189) |
50 mg/l |
Table 9: Discharge limits for Brandasund (Industry - Slaughterhouse), Low risk of water stress.
|
Source |
Component |
Degree of purification |
Yearly discharge (kg/ton) |
|
Wastewater |
Fat and Grease |
100 ml/l |
0,7 |
|
Wastewater |
Biological Oxygen (BOD) |
500 mg/l |
3,7 |
|
Wastewater |
Chemical Oxygen demand (COD) |
600 mg/l |
4,5 |
Table 10: Discharge limits for Lerøy Portugal (VAPS&D segment) medium to high risk of water stress
|
Source |
Component |
Degree of purification |
|
|
Wastewater |
Total suspended solids |
35 ml/l |
|
|
Wastewater |
Biological Oxygen (BOD) |
25 mg/l |
|
|
Wastewater |
Chemical Oxygen demand (COD) |
125 mg/l |
In Holland there are no regulations for discharge water for our operations, they are only required to analyse their waste water before release to municipal water treatment plant once pr year. They also analyse weekly for COD.
In our farming segment our most water intensive operations are the juvenile fish production, and discharged wastewater from these operations are managed through approvals from local governments. Sludge collected from waste water on-site are either composted to soil improvement (Fertilizer) or Biogas.
New technology and proximity to a biogas facility in Sweden have made it possible for one of our factories to send wastewater for treatment there, and at the same time recover biogas from the wastewater discharge. This has resulted in eliminating treatment on site which is beneficial for all parties.
Using RAS technology allows us to discharge the recycled water directly back to the source or directly to the sea according to our permits. These permits for release of discharge water have different parameters which needs to be fulfilled based on location (See table 6-10 above).
Lerøy stive to material recover 100 % of our by-products from our operations. In 2022 we material recovered 98 % of our organic by-products. By products are either used for human consumption, sold as Animal feed ingredients, converted to fertilizer or sent to biogas production (effluents).
In partnership with a feed supplier Lerøy has invested in regenerative agriculture. 30% of wheat and corn crops are sourced from regenerative farms. We aim to continue and grow our investment to ensure that our suppliers of vegetable ingredients can diversify or rotate crops, move away from monoculture and develop cover crops. Lerøy has also invested in alternative feed sources such as macro Algae and insect protein.
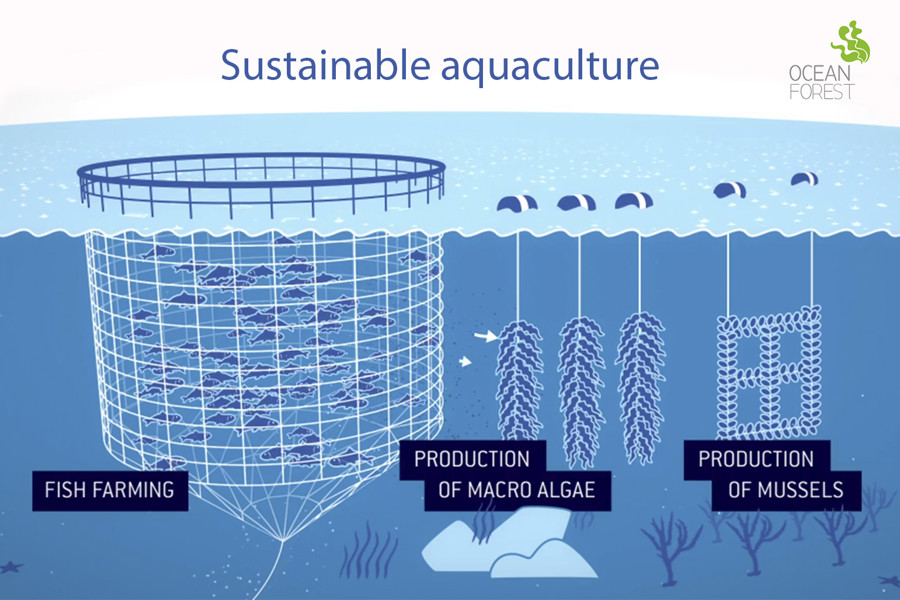
Lerøy has a broad collaboration with various third-party companies also regarding water use and nutrient management in our operations. As an example we can mention our joint venture with the environmental protection organisation Bellona. Bellona and Lerøy has a joint venture, Ocean Forest, were we collaborate on producing blue mussels and algae’s, useing nitrogen, phosphorus and nutrient salts from our production of salmon. More information on Ocean Forest.
Bellona also function as a third party advisory related to sustainable water quality and nutrient management in our supply chain.
All Water related non-conformites are reported, handled and stored in our Quality Management system. This system enables us to keep track of trends and implement correct corrective and preventive actions. Lerøy had no major incidents regarding wastewater spills or unwanted/unplanned discharge in 2022.
Water Consumption
In Accordance with CDP reporting framework we started to measure consumption of fresh water in January 1st 2022. Please see table 4 above for consumption data for the entire Group. The consumption of freshwater is calculated based on water withdrawal and water Discharge (Water withdrawal – Water discharge = Water consumption). The total consumed water in medium to high risk of water stress areas were 3 Megalitre (ML) in 2022. Our target for consumption of water in medium to high areas in risk of water stress, is to maintain a stable water consumption in our operations. The reasoning behind the decision is that we are dependent on water for Ice production to cool our products to maintain food safety and quality, and to produce Brine for our smoked products
Regarding the groups withdrawal of seawater for our processing operations, all withdrawn seawater is discharged directly back to the sea or municipal treatment centre.
The consumption of fresh water are related to ice production and Brine injection in our Industry and VAPS&D segment. From 2023 the consumption of water related to Rice cooking (sushi production) will also be included in the reporting. Not all factories have these activities so the consumption is zero for these units.
Lerøy do not use any water storage (facilities or reservoirs).
Water management Suppliers
An important part of Lerøys strategy is ensure that our suppliers operate and perform sustainably, also regarding water use, pollutants and consumation of water. Through dialogue, support and partnerships we will ensure that all of our value chain operate in accordance with sustainable principles. Lerøy have among other a collaboration with feed suppliers on water risk Management. It is important to determine the full risk profile and understand the actions needed to minimize risks linked with water use related to agriculture raw materials. We are in the process of finalizing a risk assessment survey to fully understand the suppliers risk profile and which actions have to been taken on water related infrastructure, sustainable water withdrawal, sustainable water supply, buffer zones and the protection of water bodies from pollution. This also includes the use of pesticides in Agriculture. This requirement has resulted in a water conservation and efficiency plan for each supplier. More information can be found in our Supplier Code of Conduct and Code of conduct .
We are working with our suppliers to increase data quality for water withdrawal, water discharge and consumption of water in the feed supply chain. Data regarding total water use in m3 for 2022 are Calculated using LCA Coefficients : Water use.
| Water use total m3 | 8580000 |
| Water use intensity m3/kg | 0,052 |
Based on available data, our feed suppliers have done a risk assessment (WRI Aquaduct) of water scarcity to determine which main vegetable raw materials in fish feed are sourced from areas with water stress. The WRI Aquaduct tool have restrictions when analysing based on Raw material. The analysis is therefore based on average score on country level, presented as Europe.
Example, Rapeseed is sourced from Belgium (WRI Score 48), France (WRI score 31), Netherlands (WRI score 29) and Russia (WRI Score 15). The average is between 20-40 % score and presented as having a medium to high risk of water stress.
We are, together with our feed suppliers, in dialogue to better understand the methology and data quality needs to be able to disclose a complete and accurate data set. We are in the process, but it will take time still because of the availability and on current methology.
| % Sourced | Average Water stress score (WRI) | Water stress | |
| Brazil - Soy | 70 | < 10% | Low |
| Europe - Soy | 30 | < 20 % | Low-medium |
| Europe - Wheat | 100 | < 20 % | Low-medium |
| Europe - Rapeseed | 100 | < 40 % | Medium - High |
For more information please see our Fish feed Policy
Improving our handling and sorting of waste is a continuous priority for LSG. Increasing our sorting grade of waste for reuse and material will greatly impact our environment through reduction of unwanted, hazardous and non-biodegradable waste in the environment .
In late 2022 LSG signed a corporate agreement with one waste handling company in Norway to handle all waste from our operations in Norway. This will significantly increase our waste handling Management opportunities and secure that our waste is treated in the most sustainable manner possible. The agreement will also ensure that the data quality of reported waste and treatment method is better. An automated transfer of data to our Environmental accounting system (Cemasys) is in place which will also result in a decrease in manual labour connected to reporting.
Throughout the year we communicate through different forums with our stakeholders to discuss our immediate -and potential impacts regarding waste. It is important that we get input from our stakeholders on what they find important and are concerned about so that we can improve our waste handling and implement best practices. Our waste handling company in Norway are for example involved in, and have give input on how we have formulated our KPI on recycling.
Using one strategic partner for all our waste handling in Norway will significantly influence how the local and central management works with waste. It will also give us the opportunity to better influence how -and what happens with our waste fractions. We see several opportunities in the future to strengthen our engagement and commitment to increase our degree of recirculation within the group, also outside of Norway. We are looking at the possibility to expand this strategic agreement to also include Scandinavian countries where we have operations.
The Corporate agreement with one waste handling company in Norway has:
1) resulted in better reporting functionality
3) resulted in an infrastructure to handle and maintain service for all our locations in Norway
4) resulted in a clear strategy for recycling
5) Resulted in increased knowledge and knowhow regarding waste sorting and treatment
6) Given us new ways to communicate with stakeholder and other third party organizations through the waste handling company.
Next year a new EU directive on waste handling will be applicable for our operations. New targets for diverting waste from disposal is included in the directive. Our new aggremet with one waste handling company will help us reach these targets .
Using one supplier will also put us in a position to better influence that our waste is not unnecessarily sent for disposal which can impact the environment negatively. This is however more difficult in our downstream operations where each company still uses local suppliers. This results among other things in volumes of waste being diverted from recycling to landfill or Incineration (energy recovery). We are working with our suppliers downstream in Europe to better understand how we can increase our share of waste being diverted to recycling.
In collaboration with our waste handling companies (both in Norway and Europe) we have implemented sorting regimes in all our locations and strive to make sure that all our waste is handled in a sustainable way by us and the recipient of the waste. In this the different waste handling companies, local and National governments are the main contributor and drivers to make the big changes. Without involvement, dedication and investments from them, it is difficult to see a significant change in share of waste being diverted to recycling.
We are committed to continue our work with different stakholders and the UN Global Compact initiative to do what we can to push for change within the national and global regulations for waste handling and sorting. Our companies will also continue to audit and followup our suppliers on waste handling to make sure that our waste is handled in a legal and sustainable manner.
All waste fraction data is mandatory to report to the group through its environmental reporting system (Cemasys). Data reported monthly is based on invoice from Waste handling companies.
Lerøy have not received any whistleblowing cases regarding waste management, waste handling or any misconduct regarding waste in 2022. We have neither received any fines, lawsuits or other legal actions towards us in connections to our waste handling and management.
Safety for our workers are always high on our priority list. Making sure that no one gets injured or sick handling waste in our, or our suppliers workspace is essential and governs our operations. Strict HSE procedures and guidelines are in place to ensure that our workers health and safety is secured. All employees who have training and are approved for handling hazardous waste is provided with required protective equipment.
For more information regarding our waste managment please see our Policy on waste management
Our goal for 2022 was to increase the share of inorganic waste being recycled by 5 % compared to 2021.
The group reduced its share of non-organic waste which was recycled (Material recovered and re-used) in 2022 with 8,5 % compared to 2021. Our share of recycled waste was 44,88 % (2 794 644 kg) compared to 53,42 % (3 198 029 kg) in 2021. The total volume of inorganic waste in the group have increased from 5 986 758 kg in 2021 to 6 227 329 kg in 2022.
The main reason for the reduction in recycled waste is mainly related to reporting practices and knowledge in our companies regarding waste handling and treatment. After conducting a quality control of reported numbers we saw that many companies did not report treatment type correctly. The main reason was lacking information from their waste handling company, and in some cases lacking understanding of waste handling in general.
We have therefore increased our focus on training, knowledge sharing and supplier followup to make sure that the data quality from our operations in Europe are equal to our Operations in Norway. Actions taken to increase data quality:
We feel confident that our share of recycled in organic waste will increase in 2023 as a result of our strategic partnership with one supplier of waste in Norway, and our actions taken in our Downstream operations.
Waste presented in tables below are reported from our production operations throughout the group. We also have small volumes of waste generated from our offices.
Table 1: Overview of inorganicwaste volumes in Tons per treatment type, % of total waste and % change compared to last year (2021) in LSG.
|
Treatment type |
Volume in tons |
% of total waste |
% Change (last year) |
|
Material recovery |
2 327 |
37 |
-25 |
|
Reuse |
478 |
8 |
397 |
|
Energy recovery |
3 075 |
49 |
41 |
|
Landfill/ Composting |
357 |
6 |
-40 |
The change in Reuse compared to last year is mainly because increased data quality.
Our goal for 2023 is to increase the non-organic waste which is recycled (material recovered) to 50 % in 2023, and 65% in 2030
Our target to increase the share of inorganic waste which is material recoverd is ambitious. We feel however confident that it is possible to reach the target in partnership with our waste handling company. In accordance with the EU Waste Directive the target for 2030 is 65 %.
The share of hazardous inorganic waste in LSG is still low, but has increased from 0,01 % in 2021 to 2,1 % in 2022. The increase is mainly related to increased focus on reporting and data quality. Some of our factories still use fluorescent lights, so by changing them to LED lights we can reduce this even further. In addition, the electrifying of our feeding stations will also reduce our hazardous waste by eliminating the use of oils and lubricants for our generators. Lerøy did not have any hazardous organic waste in 2022. The prosentage of total Hazardous waste (including organic waste) was 0,16 % in 2022.
Table 2: Waste by composition, in metric tons. Organic waste included.
|
Waste Generated |
Waste diverted from Disposal |
Waste directed to disposal |
|
|
Non Hazardous Waste |
84 475,8 |
80 902,5 |
3 573,3 |
|
Hazardous Waste |
134,4 |
66,2 |
68,1 |
|
Total Waste |
84 610,2 |
80 968,8 |
3 641,4 |
Table 3: Non Hazardous Waste diverted from disposal by recovery operation, in metric tons. Organic waste included
|
Onsite |
Offsite |
Total |
||
|
Non Hazardous waste |
Preparation for reuse |
0 |
456,0 |
456,0 |
|
Recycling |
0 |
80 446,5 |
80 446,5 |
|
|
Other recovery operations |
0 |
0 |
||
|
Waste prevented |
|
|
|
80 902,5 |
Table 4: Hazardous Waste diverted from disposal by recovery operation, in metric tons. Organic waste included
|
Onsite |
Offsite |
Total |
||
|
Hazardous waste |
Preparation for reuse |
0 |
11,1 |
11,1 |
|
Recycling |
0 |
55,2 |
55,2 |
|
|
Other recovery operations |
0 |
0 |
0,0 |
|
|
Waste prevented |
66,2 |
Table 5: Hazardous Waste directed to disposal by disposal method, in metric tons. Organic waste included
|
Onsite |
Offsite |
Total |
||
|
Hazardous waste |
Incineration (with energy recovery) |
0 |
67,7 |
67,7 |
|
Incineration (without energy recovery) |
0 |
0,0 |
0,0 |
|
|
Landfilling |
0 |
0,458 |
0,5 |
|
|
Other disposal operations |
0 |
0 |
0 |
Table 6: Non Hazardous Waste directed to disposal by disposal method, in metric tons. Organic waste included.
|
Onsite |
Offsite |
Total |
||
|
Non Hazardous waste |
Incineration (with energy recovery) |
0 |
3 007,4 |
3 007,4 |
|
Incineration (without energy recovery) |
0 |
0,0 |
0,0 |
|
|
Landfilling |
0 |
357,1 |
357,1 |
|
|
Other disposal operations |
0 |
0 |
0 |
LSG did not store any waste onsite longterm during 2022. Some Hazardous wastes of small quantities are stored safely and with in regulations in storage lockers design for the purpose. Waste handling company handles and transport in accordance with relevant regulations.
ORGANIC NON-EDIBLE MATERIALS
Organic waste in the group is reported in accordance with (EU) nr 142/2011. Category 2 and 3 Organic non-edible materials from our activities is respectively 7,9 % and 14,3 % of the total volume produced per segment (Farming category 2, Industry and VAPS&D for Category 3). Our total organic waste, including Category 2, 3 and organic sludge is 11,9 % of the total volume produced. Organic sludge contributes to 0,74 % of the total.
The Group strives to increase the share for human consumption, and aims to increase the share by 50% by 2024. Projects across the Group have been ongoing since 2019.
We have invested in a harvest boat which will significantly increase fish welfare and volumes for harvest from our farming operations. This will reduce the volume in Category 2 significantly. In addition, several projects in our VAP, Sales and Distribution segment will contribute to the reduction of food waste and increase the level of raw materials for human consumption.
In addition we have several initiativs going to better utilice the potensial in our sludge generated. Sludge from our farming and Industry are uteliced both for biogas production and earth improvement (compost in agriculture).
RECYCLING
Recycling our output factors where we can is important. This includes both inorganic -and organic wastes. Together with our waste handling companies we strive to increase the share of waste which is re-used or material recovered. Together we have initatives to find the best solutions for upcycling and downcycling our waste fractions.
The Group is actively involved in the process of recovering plastic waste from the oceans through different programs, in order to protect marine wildlife. One of the activities is recycling our fish farming nets, ropes and old trawlernets.
Another activity is: “ Only on loan”. This is a project in which Lerøy Seafood works together with waste and recycling company Norsk Recycling to ensure that the packaging for products packed in aluminium trays is returned for recycling after use. Such packaging is therefore only “on loan”.
Waste is a resource that is not properly utilised, and we aim to do something about this. We also focus on using the correct packaging and the correct size of products in order to avoid waste.
USE OF ORGANIC SLUDGE FROM SMOLT PRODUCTION
Since 2013, when the juvenile production facility Belsvik opened, we have sent our organic sludge to a biogas production facility. The use of Organic sludge as biogas is sustainable, but we have found that long transportation of sludge with high content of water was less sustainable. We do not release an sludge to public waterways.
Investment in a drying facility on location was therefore recently decided and from 2023 we will be able to deliver dried sludge to the agriculture industry.
The Sludge will be used as a soil improvement material and fertilizer. Our other two major smolt production sites in Laksefjord and Kjærelva is already drying their sludge on site for the agriculture industry.
SUGAR KELP
The Group is also producing sugar kelp, which is another example of recycling. When we produce sugar kelp we use the nutritions from fish farming to produce sugar kelp and blue mussels.
Food waste includes all usable parts of food produced for humans, but which are either discarded or removed from the food chain for purposes other than for human consumption.
Lerøy work towards reducing fish mortality, floor fish and unsold products. As a result; the fish itself and the resourses spent to farm or catch it, becomes available for human consumption. This generate a positive effect generating nutritious food for the population, better utillization of natural resourses, icreased earnings and employment
Food lost could be used to feed the global population and increase food security. Lerøy is directly involved in negative impacts in the farming segment regarding survival rate. Fish lost results in loss of natural resources(i.e feed) , lost value creation and reputation. Reducing food waste is an opportunity to increased efficiency and competitiveness, which can result in increased exports and earnings.
100kg fish = 100 kg product for human consumption

The Farming segment has introduced targeted measures to reduce food loss by minimising fish mortality. Among several action point, this involves transferring larger smolt at sea at the correct time, a high Omega 3 content in our feed to make our fish more robust, and investments in harvest boats with slaughtering facilities so that fish can be slaughtered directly at the edge of the cage.
The Wild Catch segment aims to reduce food loss by preserving residual raw materials, producing meal, oil and ensilage that can be returned to Lerøy's value chain. This process involves optimising production of meal, oil and ensilage on board the Group's trawlers.
The VAP Sales & Distribution segment is taking action to reduce food waste by reducing the number of fish that fall on the floor, using the entire fish with our concept, “we use it all”, reducing the number of unsold products and non-utilised input factors in production, and optimising the shelf life of our products.
Since 2017, SINTEF Ocean, commissioned by the Norwegian Fisheries and Aquaculture Industry's research funding (FHF), has carried out investigations into the amounts and causes of food waste in the Norwegian seafood industry. In 2022, it was decided to continue the project with a duration until 2026, so that it covers the next main reporting (2025 figures). Lerøy Participate in the reference group in the project.
In the work towards 2026, where annual reports will be carried out, it is desirable to strengthen the data base in order to improve insight into the amount and causes of food waste in the industry. This can help to shine a spotlight on critical points that must be addressed in order to prevent and reduce food waste in the future.
Policy: Food waste
All companies in the group report their results every quarter through the reporting tool Cemasys. The impact is visualized both at group and company level through reports in PowerBI and evaluated quarterly. If the performance trend deviates from the target (0 or negative), the cause must be identified and specific measures implemented, the effect of the measures evaluated and possibly adjusted towards the next quarterly measurement.
Regarding result on survival in sea more information available here.
As part of a project called 50/50-5 project, Lerøy has introduced sub-projects throughout the value chain to reduce food waste by 50% within 2024 from base year 2019.
In wild catch segment - the target is to presarve residual raw material and increase the production of meal, oil and ensilage with 50% from 2019 to 2024. From 2019 to 2023 the volume have increased from 2669 tonnes to 4840 tonnes. The reason for the increase is mainly cause of the vessel Kongsfjord producing silage from 2020 and optimalization of oil and meal production on other vessels. The production have increased by 81% from 2019, above target, and are utilized as an ingredient in our feed to farming division.
In Industry/VAP segment the target is to reduce the Level of floor fish and unsold products with 50% from 2019-2024. The result in 2022 was 293 893 kg, this was an increase from 2021 with 167 478 kg (+66%). We believe the increase in volume is caused by improved registration of food waste by our processing facilities. All facilities are working according the action plan to reduce floor fish and unsold products.
|
|
Target 2024 |
2022 |
2021 |
2020 |
2019 |
|
Farming Survival in sea (%) |
94% |
92,5% |
92,5% |
92,1% |
93,4% |
|
Wild Catch Increase production of meal, oil and ensilage (kg) |
+50% |
4840000(+81%) |
5439000(+104%) |
5023000(+88%) |
2669000 |
|
Industry Reduction in fish on floor and unsold products (kg) |
-50% |
293893 (+66%) |
167478 (-5%) |
176868 |
-* |
* data from 2019 is deficient or not complete. Base years must therefore be evaluated from the year 2020.
Lerøy is a Partner on the Norwegian authority project to investigate measures to halve food waste, including a food waste law. Climate and Environment Minister Espen Barth Eide and Agriculture and Food Minister Sandra Borch present the committee which will investigate measures to achieve the goal of a 50 percent reduction in food waste by 2030. Among other things, the committee will come up with a proposal for a food waste law. Lerøy participate in the discussions and supply food loss data to the project, the work will be delivered in the form of a written report to the Ministry of Climate and the Environment and the Ministry of Agriculture and Food by 31 December 2023.
Participation in the project Charting food waste in the seafood industry, managed by Sintef
Further investment in processing facility for exploitation of residual raw materials from own factories to produce different types of processed fish (fish cakes, fish pudding)
24% increase in shelf life of consumer packages by making use of new Co2 emitters in consumer packages. A longer shelf life provides improved predictability and less waste.
Further development of the “we use it all” project by offering customers different products made from residual raw materials
Exploiting residual raw materials from the Wild Catch segment in feed for the Farming segment. This may involve increasing the content of marine raw materials in the feed, which in turn makes the salmon more robust and increases survival rates, or further reductions in the amount of wild caught fish from commercial fisheries in our feed.
Initiation of a new packaging method for whole salmon and fillets. This involves using new technology allowing for transport of fresh fish by boat over longer distances, where the shelf life starts when the package is opened. This allows for more control over time and shelf life of raw materials used in production.
Every year, more than eight million tonnes of plastic end up in the sea, and more than 90 percent of all seabirds have plastic in their gut. In 2050, there will be more plastic in the sea than fish. Plastic in itself becomes a problem when it is carelessly disposed of, represents a threat to animal life and ends up as microplastic in the sea. Microplastics accumulate in the food chain, bringing with them environmental toxins that negatively affect food safety in the food we eat.
Reduce the total consumption and prevent inappropriate disposal of plastic.
As part of the 50/50-5 project, Lerøy has introduced sub-projects throughout the value chain to reduce general plastic consumption and consumption of non-recyclable plastic by 50% within 2024. Each segment is measured in terms of development, and initiatives are shared across the Group. For Farming segment; Purchased feeding tube & ropes are measured, for wildcatch and the VAPS&D segment purchased vacuum film, single use plastic and EPS are measured.
Lerøy take part in a number of measures to to clear up plastic in the environment read more about this here.
All companies report their results every quarter via the Cemasys reporting tool. Impact is illustrated both at Group and company level with the PowerBI analysis tool. If the performance trend deviates from the target (0 or negative), the cause must be identified and specific measures implemented, the effect of the measures evaluated and possibly adjusted towards the next quarterly measurement.
Lerøy has taken part in a project together with NORCE to investigate the amount of microplastic in fish fillets and organs in farmed salmon – SalmoDetect.
By reducing a chamber previously used to label products in plastlink, we were able to reduce our plastic consumption by 10,000 kg. Labels are now placed directly on the foil.
By reducing the thickness of vacuum film for certain products, we have been able to substantially reduce our plastic consumption without having an impact on the technical properties of the film.
By collaborating with our customers, we have increased the percentage of filling for our products so that we use less plastic in kg per kg of product.
Lerøy shall have an overview of plastic purchased throughout the entire Group. Lerøy shall also assess waste management and recycling of these types of plastic to determine the level of sustainability across national borders.
We shall limit the use of plastic when other sustainable materials meet the technical requirements. We shall play an active role in the development of alternative packaging materials for consumer packages and distribution packages.
For 2022 the group used 8 392 168 kg of plastic within the identified areas, this is an substantial increase from 2021. In the last year, the group has run a project called sustainability in daily operations.
The purpose of the project is to create awareness in the organization in order to obtain correct and verified reporting of sustainability figures with associated reduction measures. We believe that the reason for the increase is better quality reporting in the organisation.
| Target 2024 | 2022 | 2021 | 2020 | 2019 | |
| Volume plastic purchased (Kg)* | - 50% | 8 392 168 | 6 029 351 | 6 009 237 | -* |
* data from 2019 is deficient or not complete. Base years must therefore be evaluated from the year 2020.