-
SEARCH
Type your search in the field above

Potential negative and positive effects on the economy, the environment and people
Climate change refers to long‑term changes in the Earth’s climate system, including changes in temperature, precipitation, and weather patterns, primarily caused by human activity.
Climate changes can cause several negative impacts such as:
Rising sea levels: As global temperature rises, glaciers and ice sheets melt, and sea levels rise. This could lead to flooding of low-lying areas and displacement of millions of people.
Extreme weather events: Climate change leads to more frequent and severe weather events, including hurricanes, droughts, heatwaves, and wildfires. These events can cause significant damage to infrastructure, homes, and ecosystems.
Loss of biodiversity: As temperatures rise, many species may be unable to adapt to changing conditions and may go extinct. This could have cascading effects on ecosystem and food chains.
Water scarcity: Climate change is expected to lead to more frequent and severe droughts, which could lead to water scarcity in many regions. This can potentially cause conflicts over water resources and harm agriculture and food production.
Health impacts: Climate change could lead to increased incidence of several diseases. This could have significant impacts on public health and healthcare systems.
Economic impacts: Climate change could lead to significant economic impacts, including damage to infrastructure, lost productivity, and higher costs for disaster relief. These impacts could be particularly severe for low-income communities and developing countries.
Climate action and environmental performance
2025 was confirmed as as one of the three warmest years on record globally (with records going back to 1850). According to the World Meteorological Organization (WMO), the global average surface temperature in 2025 was approximately 1.44 °C above the pre‑industrial level (1850–1900). While slightly cooler than the record‑breaking year 2024, 2025 continued an unprecedented streak of extreme warmth, with the past three years (2023–2025) collectively averaging above 1.5 °C relative to pre‑industrial levels. These findings underscore that global warming remains firmly elevated despite short‑term natural variability, reinforcing the urgency of sustained and decisive climate action.
Lerøy is aware of its responsibility to contribute to climate action by reducing emissions of carbon dioxide and other greenhouse gases (GHGs).
The Group generates GHG emissions through its operations and therefore conducts GHG reporting covering Scope 1, Scope 2 and Scope 3 emissions. This reporting enables Lerøy to monitor and manage emissions from its own operations as well as relevant parts of the value chain, and to identify and implement appropriate measures to reduce its overall GHG emissions.
The Group also indirectly contributes to deforestation through the purchase of fish feed. Lerøy therefore works proactively with its business partners, including fish feed suppliers, to develop and promote alternative fish feed ingredients.
Lerøy has entered into a strategic partnership agreement with a fish feed supplier. This type of partnership ensures close collaboration with a supplier that has also established ambitious targets for reducing greenhouse gas (GHG) emissions.
Lerøy generates waste, including plastic waste; however, the Group is taking appropriate measures to reduce its contribution to waste pollution. For more detailed information on waste and pollution, please refer to the section Water and Waste Management (Environment) in the Lerøy Sustainability Library 2025.
Lerøy has developed Climate and Energy Consumption Policy which sets out a range of actions and measures aimed at addressing climate change and introducing sustainable business practices. The goal of the policy is to mitigate the negative impacts of climate change and reduce risks associated with it.
Actions taken to manage the topic and related impacts:
Regular reporting and monitoring of greenhouse gas (GHG) emissions are conducted to enable emission reductions, track developments and trends, and manage Lerøy’s impact on climate change.
Lerøy adapts to the impacts of climate change by implementing appropriate measures across its operations, recognising that climate change affects operational activities in different ways.
The Group participates in various research and development activities that are critical to addressing climate change and identifying effective solutions. Lerøy is involved in several initiatives aimed at developing new technologies that can contribute to reducing climate-related impacts.
Lerøy promotes sustainable business practices by increasing organisational awareness of climate change and informing stakeholders about the actions taken to reduce GHG emissions. Stakeholders are informed through annual and quarterly reports, website updates, and news articles on social media. The effectiveness of these actions is discussed in the Group’s annual report. Lerøy also reports to CDP.
Lerøy is continuously working on improving its monitoring and reporting of greenhouse gas emissions. Information regarding our greenhouse gas emissions is crucial for understanding and responding to environmental challenges as well as to being able to identify improvement opportunities.
Gross Scope 1,2 and 3 emissions
The Group’s GHG emissions are reported in accordance with the ESRS E1 reporting standard, which is based on the GHG Protocol Corporate Accounting and Reporting Standard. Direct emissions from the Group’s own operations are included in Scope 1 and 2 and cover both owned and leased assets. Indirect upstream and downstream emissions related to the Group’s operations are reported under Scope 3. Monthly reporting covers fossil fuel consumption, refrigerants, electricity, district heating/ cooling, water usage, waste composition (incl. methods of waste disposal). Climate accounts are consolidated in the same manner as financial statements presenting aggregated results for the Group’s entities (reporting units).
Emission factors
Emissions data for Scopes 1, 2 and 3 include the greenhouse gases that contribute to climate change, as defined under the Kyoto Protocol.
Scope 1
Sources for Scope 1 emission factors used for calculation of tCO2e are DEFRA (Department for Environmental Food and Rural Affairs, UK Government), 2024, 2025, Norwegian Environmental Agency (2024), GHG Protocol, IPCC Global Warming Potential Values 2024, Linde Gas (2019; 2022), A-gas, Honeywell Refrigerants (2014), Kaltra (2024).
Scope 1 emissions from leased assets in 2025 amounted to 49,621 tCO2e out of a total of 173,862 tCO2e, corresponding to approximately 28.5% of total Scope 1 emissions, while Scope 2 emissions from leased assets were 4 tCO2e out of a total of 7,009 tCO2e, corresponding to approximately 0.06% of total Scope 2 emissions. In comparison, Scope 1 emissions from leased assets in 2024 amounted to 37,313 tCO2e out of a total of 156,638 tCO2e, corresponding to approximately 23.8% of total Scope 1 emissions, while Scope 2 emissions from leased assets were 8 tCO2e out of a total of 8,210 tCO2e, corresponding to approximately 0.1% of total Scope 2 emissions.
Scope 2
There are two types of Scope 2 emissions: location-based and market-based. Location-based Scope 2 emissions are calculated using the average emissions factor for the grid region where the organisation consumes electricity. Market-based Scope 2 emissions, by contrast, reflect the specific contractual instruments the organisation uses, such as renewable energy certificates or power purchase agreements. Sources for Scope 2 emission factors used for calculation of tCO2e are: International Energy Agency (2025), Energinet (2023) Foreløbig national deklarering af 1 kWh el; 2022, Generelle eldeklaration 2022 IEA (2025), Energy Statistics Data Browser AIB (2025), European residual mix/ Guarantee of Origin data Green-e (2024), Unweighted average for all 27 eGrid subregions (CEMAsys calculation) IEA (2024), Energy Statistics Data Browser NVE (2025), Klimadeklarasjon for fysisk levert strøm 2024; Varedeklarasjon for strømleverandører 2024 Ei (2025), Nordic residual mix COES (2024) 2024, Statistics Energinet (2025), Foreløbig national deklarering af el 2024, Fjernkontrollen (2025). Energistyrelsen (2025). Finnish Energy (2025).
Scope 3
Sources for Scope 3 emission factors used for calculation of tCO2e are: The primary datasets include DEFRA (2025) and DEFRA (2024), together with international energy data from the IEA (2025) and IEA (2024) Energy Statistics Data Browser. Life-cycle based factors are drawn from Ecoinvent in versions 3.12, 3.11, and 3.9.1, supplemented by emissions factors from EPA (2024), v1.3. For United States commodity categories, the factors originate from Cornerstone (2025), Supply Chain GHG Emission Factors for U.S. Commodities (v1.4.0).
National and authority-level data sources include Statistics Norway (SSB, 2024), the Norwegian Environment Agency (2024), and energy consumption data from Norsk Energi (2020) and the Norwegian EV Association. Additional transport-related factors are based on Ruter (2024) Environmental Reporting, the Swedish Transport Agency, SJ AB Annual and Sustainability Report 2024, and Drivmedel 2023. Company-specific emission factors and disclosures are taken from the Vygruppen Annual and Sustainability Report 2024 and the VR Group Annual Report 2023, as well as internal company-specific data where explicitly stated. Supplementary studies include SINTEF’s “Greenhouse gas emissions of Norwegian seafood products” (2017) and the research article “Investigating the impact of e-bikes on modal share and GHG” (2019). Several factors have also been calculated by CEMAsys, using combinations of IEA statistics, Ecoinvent datasets, national reporting, transport sector disclosures, and energy consumption benchmarks.
The reported emission figures have been collected throughout 2025 both internally and from relevant external suppliers.
Scope 1, 2 and 3 GHG emissions 2025 (including % change compared to the base year (2019) and the comperison year (2024))
| Base year (2019) | Comperative year (2024) | Recent year (2025) | % change vs base year (2019 vs 2025) | % change vs recent year (2024 vs 2025) | |
| SCOPE 1 | |||||
| Gross Scope 1 GHG emissions (tCO2e) | 160 138 | 156 638 | 173 862 | 9% | 11% |
| SCOPE 2 | |||||
| Gross location-based Scope 2 GHG emissions (tCO2e) | 5 917 | 8 210 | 7 009 | 18% | -15% |
| Gross market-based Scope 2 GHG emissions (tCO2e) | 44 685 | 99 862 | 88 228 | 97% | -12% |
| SCOPE 3 | |||||
| Total gross indirect (Scope 3) GHG emissions (tCO2e) | 2 012 632 | 1 693 961 | 1 753 264 | -13% | 4% |
| Purchased goods and services(tCO2e) | 1 278 592 | 902 350 | 910 500 | -29% | 1% |
| Capital goods (tCO2e) | 27 046 | 36 376 | 27 589 | 2% | -24% |
| Fuel and energy related activities (tCO2e) | 36 726 | 39 522 | 42 891 | 17% | 9% |
| Upstream transportation and distribution (tCO2e) | 543 935 | 533 618 | 615 532 | 13% | 15% |
| Waste generated in operation (tCO2e) | 3 061 | 4 612 | 3 931 | 28% | -15% |
| Business travel (tCO2e) | 633 | 798 | 781 | 23% | -2% |
| Employee commuting (tCO2e) | 6 186 | 7 396 | 7 676 | 24% | 4% |
| Downstream transportation and distribution (tCO2e) | 7 564 | 5 536 | 6 410 | -15% | 16% |
| Processing of sold products (tCO2e) | 18 488 | 22 102 | 22 776 | 24% | 3% |
| End of life treatment of products (tCO2e) | 1 882 | 1 644 | 1 638 | -13% | 0% |
| Investments (tCO2e) | 88 519 | 140 008 | 113 540 | 28% | -19% |
| Total Scope 1+2+3 (location-based) (tCO2e) | 2 178 687 | 1 858 809 | 1 934 134 | -11% | 4% |
| Total Scope 1+2+3 (market-based)(tCO2e) | 2 217 455 | 1 950 461 | 2 015 354 | -9% | 3% |
Scope 1 and 2 GHG emissions per opearating segment (2025)
| Operating segment | Scope 1 (tCO2e) | Scope 2 (location-based) (tCO2e) | Scope 2 (market-based) (tCO2e) |
| Farming | 64 572 | 1 804 | 54 863 |
| Wild catch | 106 941 | 269 | 13 249 |
| VAP, Sales & Distribution | 2 349 | 4 936 | 20 116 |
| Total | 173 862 | 7 009 | 88 228 |
| Category | tCO2e | |
|---|---|---|
Purchased goods and services
tCO2e
Emissions from Purchased Goods and Services are calculated in accordance with ESRS E1-6 and building on the GHG Protocol Scope 3 Standard and cover all Group activities within the category. Fish feed is quantified using activity-based emission factors applied to primary, volume-based activity data obtained directly from suppliers or internal procurement systems. This approach reflects the physical quantities purchased and applies established emission factors that are specific to the activity. Emissions from purchases of fish and seafood products are quantified using supplier-specific, volume-based activity data. However, the emission factor applied is a proxy emission factor. The proxy has been developed based on the Group’s own reported emissions profile and relevant activity and operational parameters, and represents an average emissions intensity derived from the Group’s disclosed emissions. This approach ensures that the calculations reflect the underlying emissions performance of the relevant activities, while avoiding the use of proprietary or non-comparable supplier-specific emission factors. The use of a proxy emission factor is considered appropriate where direct, verified emission factors are not available and is consistent with accepted GHG accounting practices. The methodology provides a reasonable and conservative estimate of emissions and supports comparability and transparency in reporting. For all remaining sub-categories within Purchased Goods and Services, emissions are calculated using spend-based emission factors sourced from the Cornerstone database. This approach applies environmentally extended input–output (EEIO) factors to the Group’s financial procurement data and provides a consistent and scalable methodology for items where primary data are not available or where the emission contribution is assessed as less material. Spend-based data are adjusted for inflation and currency effects, based on the reference year of the emission factors used. Overall, the combined methodology ensures that activity-based data are applied where available and most relevant, while the category is comprehensively covered through recognised spend-based factors, in line with corporate GHG accounting practice. |
||
Capital goods
tCO2e
Emissions from Capital Goods are calculated in accordance with ESRS E1-6 and building on the GHG Protocol Scope 3 Standard. For this category, the Group applies a spend-based approach using environmentally extended input–output (EEIO) emission factors sourced from the Cornerstone database. These factors are applied to the Group’s financial procurement data for capital investments, providing a consistent and scalable method for estimating emissions where primary activity data are not available. This approach ensures comprehensive coverage of all relevant capital goods purchases in line with recognised corporate GHG accounting practices. |
||
Fuel and energy related activities
tCO2e
Emissions from Fuel- and Energy-Related Activities are calculated in accordance with ESRS E1-6 and building on the GHG Protocol Scope 3 Standard. This category covers indirect greenhouse gas emissions associated with the production, transmission, and distribution of fuels and energy purchased and consumed by the Group, but not directly emitted. Consumption data is derived from the Group’s Scope 1 and Scope 2 reporting, ensuring consistency across inventories. Emission factors are sourced from recognised authorities, including DEFRA and the International Energy Agency (IEA), providing robust and credible estimates. This approach ensures a high degree of accuracy and methodological alignment with best practice in corporate GHG accounting. |
||
Upstream transportation and distribution (outbound transportation)
tCO2e
This category includes greenhouse gas emissions arising from the transportation and distribution of products and materials throughout the value chain. Emissions are calculated using primary activity data obtained from the Group’s logistics function, combined with recognised emission factors from DEFRA, ensuring methodological consistency and alignment with the ESRS E1-6 and building on GHG Protocol Scope 3 guidance. The calculations are based on a number of core assumptions and simplifications. Shipment weights are adjusted using standard uplift factors to account for packaging. Transport distances are estimated using a “capital-to-capital” approach for international routes, with additional adjustments applied to reflect inbound transport from slaughterhouses to the Oslo logistics hub where relevant. For each shipment, emissions are calculated based on the primary transport mode used, while secondary or auxiliary transport legs are not separately modelled. These assumptions are applied consistently across reporting periods and are considered appropriate given current data availability, while supporting comparability and transparency of reported emissions. |
||
Waste generated in operations
tCO2e
This reporting category covers greenhouse gas emissions resulting from the disposal and treatment of waste generated by the Group’s activities. Emissions are calculated using primary consumption data obtained directly from waste collection and sorting companies for operations in Norway, ensuring a high degree of accuracy. For other operating countries, data is based on available waste management records and recognised emission factors sourced from DEFRA, providing methodological consistency and alignment with ESRS E1-6 and building on GHG Protocol Scope 3 guidance. |
||
Business travel
tCO2e
This reporting category covers indirect greenhouse gas emissions arising from the transportation of employees for business-related activities in vehicles not owned or operated by the Group. Emissions are calculated using travel activity data provided by the Group’s contracted travel agency, which includes details of flights booked through the agency. Recognised emission factors sourced from DEFRA are applied to this activity data to ensure methodological consistency and alignment with ESRS E1-6 and building on GHG Protocol Scope 3 guidance. |
||
Employee commuting
tCO2e
This reporting category covers indirect greenhouse gas emissions resulting from the transportation of employees between their homes and worksites. Emissions are calculated using the average-data method, which applies typical commuting patterns and modal split assumptions based on data from relevant national statistical agencies. Emission factors are applied in line with ESRS E1-6 and building on GHG Protocol Scope 3 guidance to ensure methodological consistency.
|
||
Upstream leased assets
N/A |
||
Downstream transportation and distribution
tCO2e
This reporting category covers greenhouse gas emissions generated during downstream transportation and distribution of products and materials after they have been handed over from the Group’s facilities, or from transport service providers contracted and paid for by the Group. Emissions are calculated using primary data obtained from the Group’s logistics department, including shipment volumes and estimated transport distances, combined with recognised emission factors sourced from DEFRA. This approach ensures methodological consistency and alignment with ESRS E1-6 and building on GHG Protocol Scope 3 guidance |
||
Processing of sold products
tCO2e
This reporting category covers greenhouse gas emissions arising from energy use for the storage of sold products, as well as emissions from third-party processing before reaching the end customer. Lerøy Seafood Group accounts for the top 10 countries to which products are sold. Emissions are calculated using activity data related to volumes and destinations, combined with recognised emission factors sourced from DEFRA. This approach ensures methodological consistency and alignment with ESRS E1-6 and building on GHG Protocol Scope 3 guidance. |
||
Use of sold products
N/A |
||
End-of-life treatment of sold products
tCO2e
This reporting category covers greenhouse gas emissions associated with the disposal and treatment of products after their useful life has ended. Emissions are calculated using recognised emission factors and activity data relevant to the Group’s products. The level of accuracy for this category is considered relatively high, as reporting includes end-of-life treatment for key product types. |
||
Downstream leased assets
N/A |
||
Franchises
N/A |
||
Investments
tCO2e
This category includes greenhouse gas emissions associated with the Group’s financial investments and covers the Group’s most significant holdings, reflecting emissions from the underlying activities of these investments. Calculations are primarily based on DEFRA emission factors. For Scottish Sea Farms, an emission factor provided by SINTEF has been applied, and Scope 3 emissions have been estimated, as supplier-specific Scope 3 data are not currently available. |
||
For more detailed information regarding the categories, please visit Corporate Value Chain (Scope 3) Accounting standard
Emissions from feed production 2025, incl. land luse
| GHG emissions from fish feed | tCO2e |
| Total GHG emissions from fish feed production 2024 | 415 810 |
| GHG emissions from fish feed from Land Use Change (LUC) | 41 581 |
Production-based GHG intensity linked to core operations (Farming and Wild Catch) 2025
| Segment | Relevant Scope 1, 2 and 3 GHG emissions (tco2e) | Production volume (Farming: gutted weight (t) (GW); Wild Catch: catch volume (t)) | Intensity (tco2e/t) |
| Farming | 518 545 | 195 554 | 2,65 |
| Wild Catch | 113 810 | 57 675 | 1,97 |
In 2020, the Group set an ambitious science-based target (SBT) in line with the Paris Agreement to reduce its greenhouse gas emissions by 46% by 2030, using 2019 as the base year. The target was defined based on what were, at the time, the Group’s most significant drivers of greenhouse gas emissions for Scope 3:
- Fuel and energy related activities
- Upstream transportation and distribution
- Waste generated in own operations
- Purchased goods and services (fish feed)
- Business travel
These categories accounted for 73% of the Group’s Scope 3 emissions in 2019 and were therefore in line with the SBT requirement that at least 67% of Scope 3 emissions should be included in the target.
From the time the target was set in 2020 until today, major changes have occurred in greenhouse gas reporting, driven by new and more comprehensive reporting requirements under the CSRD. In 2025, the Group also set new strategic targets towards 2030, including an expected increase in sales to Asian markets, where parts of the deliveries depend on air freight and therefore affect greenhouse gas emissions. As a result, the Group can no longer maintain its science-based target in line with the Paris Agreement and will carry out a review of its climate target, including consideration of alternative target structures, in 2026.
The Group had a turnover of NOK 34.4 billion in 2025 and has set a turnover target of NOK 50 billion by 2030. In the period leading up to 2030, the Group will continue to focus on the largest drivers of greenhouse gas emissions and seek solutions to reduce emissions despite an expected turnover growth of 45%. These drivers are expected to remain the same as in 2019. The review will ensure that the Group’s climate targets remain relevant, ambitious, and aligned with the business strategy.
Sustainable fish feed:
Fish feed is a major contributor to the Group’s Scope 3 emissions. Its greenhouse gas intensity is driven by upstream production of feed ingredients, including soybean meal, wheat and fish meal. Emissions arise from agricultural and fisheries activities, processing and transport, as well as associated energy use, resulting in a significant contribution to total GHG emissions. Incorporating emerging raw materials—such as byproducts from European poultry production—into fish feed represents an important step towards the adoption of innovative solutions, increased circularity, and the use of new technologies.
Compared to conventional feed ingredients, such by-products can, depending on sourcing and allocation assumptions, have a lower greenhouse gas intensity and thereby contribute to reduced GHG emissions across the value chain. To further support this transition, Lerøy Seafood Group has established a strategic partnership with a fish feed supplier that integrates climate change mitigation, adaptation and energy efficiency considerations into its operations.
Upstream and downstream transportation:
Transportation to customers represents Lerøy’s second-largest source of greenhouse gas emissions, alongside purchased goods and services (including fish feed). Emissions in this category are expected to increase in line with the Group’s growth target towards 2030. Between 2019 and 2025, emissions in this category increased 13%, primarily due to higher volumes transported by air.
Although emissions from this category are expected to increase, efforts are being made to limit this increase. Prioritising and optimising transport weight, developing new technologies, and evaluating alternative transport modes are essential measures to deliver more climate-efficient logistics solutions.
Key initiatives include the development of an internal climate calculator for air transport to identify the most climate-efficient flight routes, as well as the introduction of dry ice as a cooling medium to replace conventional ice. This measure reduces the GHG intensity per transported unit.
The use of dry ice has already been implemented at several packing plants, while other transport-related initiatives remain in early stages of development and implementation.
The Group supplies seafood to global markets and is therefore dependent on international air freight transport, which represents a potential source of GHG emissions. To reduce emissions, the Group aims to shift air freight transport to lower-carbon transport modes, optimise transport capacity, improve the energy efficiency of logistics operations, and support the transition from fossil to renewable energy sources. Progress is influenced by the availability and maturity of low-carbon technological solutions within the transportation sector.
In 2025, farming companies within the Group carried out several investments related to energy efficiency, land-based power infrastructure, and facility upgrades. The total investment amounted to approximately NOK 112 million.
These investments, undertaken by farming companies within the Group, collectively contribute to improved energy efficiency and are expected to result in reductions in CO2 emissions over time.
Actual and potential future GHG emission sources:
Lerøy Seafood Group recognises that GHG emissions from trawler operations (representing the largest part of Scope 1 emissions) will persist in the future as the current business model depends on use of fossil fuels. At present, transforming this process is highly challenging, given that these trawlers have a remaining lifespan of between 5 and 30 years.The potential for significant emission reductions during their use is therefore limited, as alternative technologies are still in the early stages of development. The Group has already implemented energy efficiency measures such as installing more efficient engines to reduce fuel consumption and associated GHG emissions from the trawlers, and will continue to pursue such improvements.
Regarding Scope 3 activities – Lerøy Seafood Group will continue purchasing fish feed and raw materials in fish feed that may be associated with land use change (LUC). One of the major ingredients in fish feed – soy – is a major contributor to LUC, however the Group exclusively purchases LUC-free soy.
The Group supplies seafood to global markets and is dependent on international freight transport which will represents a potential source of GHG emissions. To reduce emissions, the Group aims to shift freight forwarding to lower-carbon transport modes, optimise transport capacity, improve the energy efficiency of logistics operations, and support the transition from fossil to renewable energy sources. Progress is influenced by the availability and maturity of low-carbon technological solutions in the transport sector.
Electrification of fleets, well boats and workboats
A large shore current system for well boats is now operational at Lerøy's Hitra facility. This investment is part of our efforts to reduce The Group's greenhouse gas emissions.
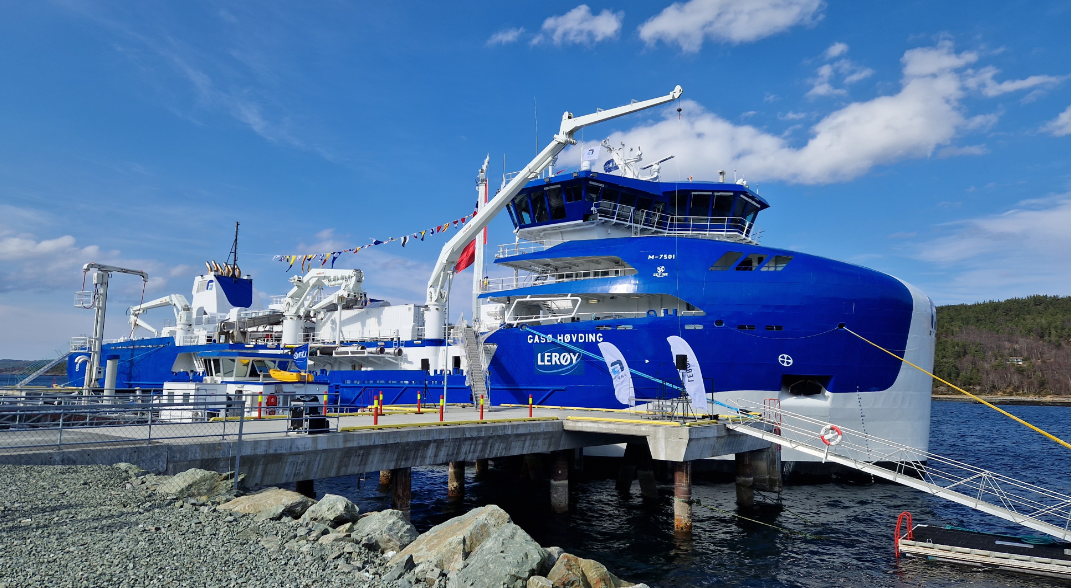
Lerøy Midt has chartered the wellboat Gåsø Høvding, designed to operate entirely on electric power for direct salmon delivery to our slaughterhouse on Jøsnøya in Hitra. The wellboat, owned by Frøy Rederi AS, has seen significant investment in its electric operation system.
With the high-voltage shore power plant investment, Lerøy Midt aims to substantially reduce nitrogen oxide (NOx) emissions and cut several thousand tonnes of CO2 equivalents annually.
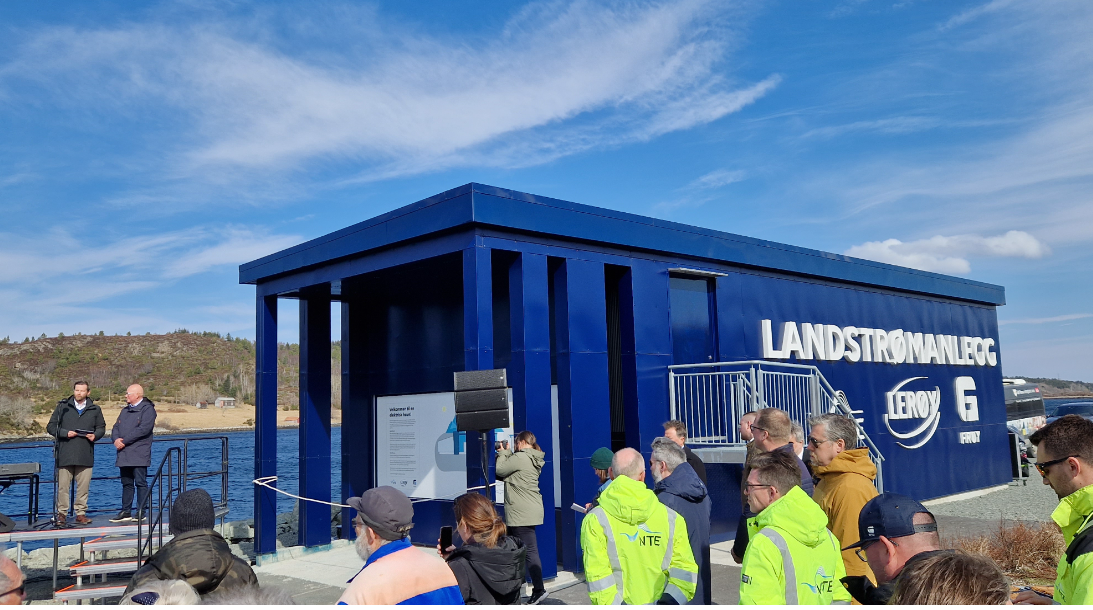
The project is a close collaboration between Lerøy Midt AS as the customer, Frøy Rederi AS which owns the wellboat and Nord Trøndelag electricity utility (NTE) which has designed and built the shore power plant.
In addition to NTE and Frøy Rederi AS, Enova (Norwegian state-owned enterprise owned by the Ministry of Climate and Environment. It provides funding and advice for energy and climate projects) has been involved and taken up to 40% of the budgeted investment costs, which has made it possible to carry out the project.
Gåsø Høvding, like other well boats, is manned around the clock, so the crew in particular will be able to benefit from the silence. This will improve the working conditions and the working environment for everyone involved, both those on board and those who work at our Jøsnøya plant. In addition to the actual transport of salmon from the cages to slaughter facility, the size of the boat allows the entire biomass from a cage to be handled in one load.
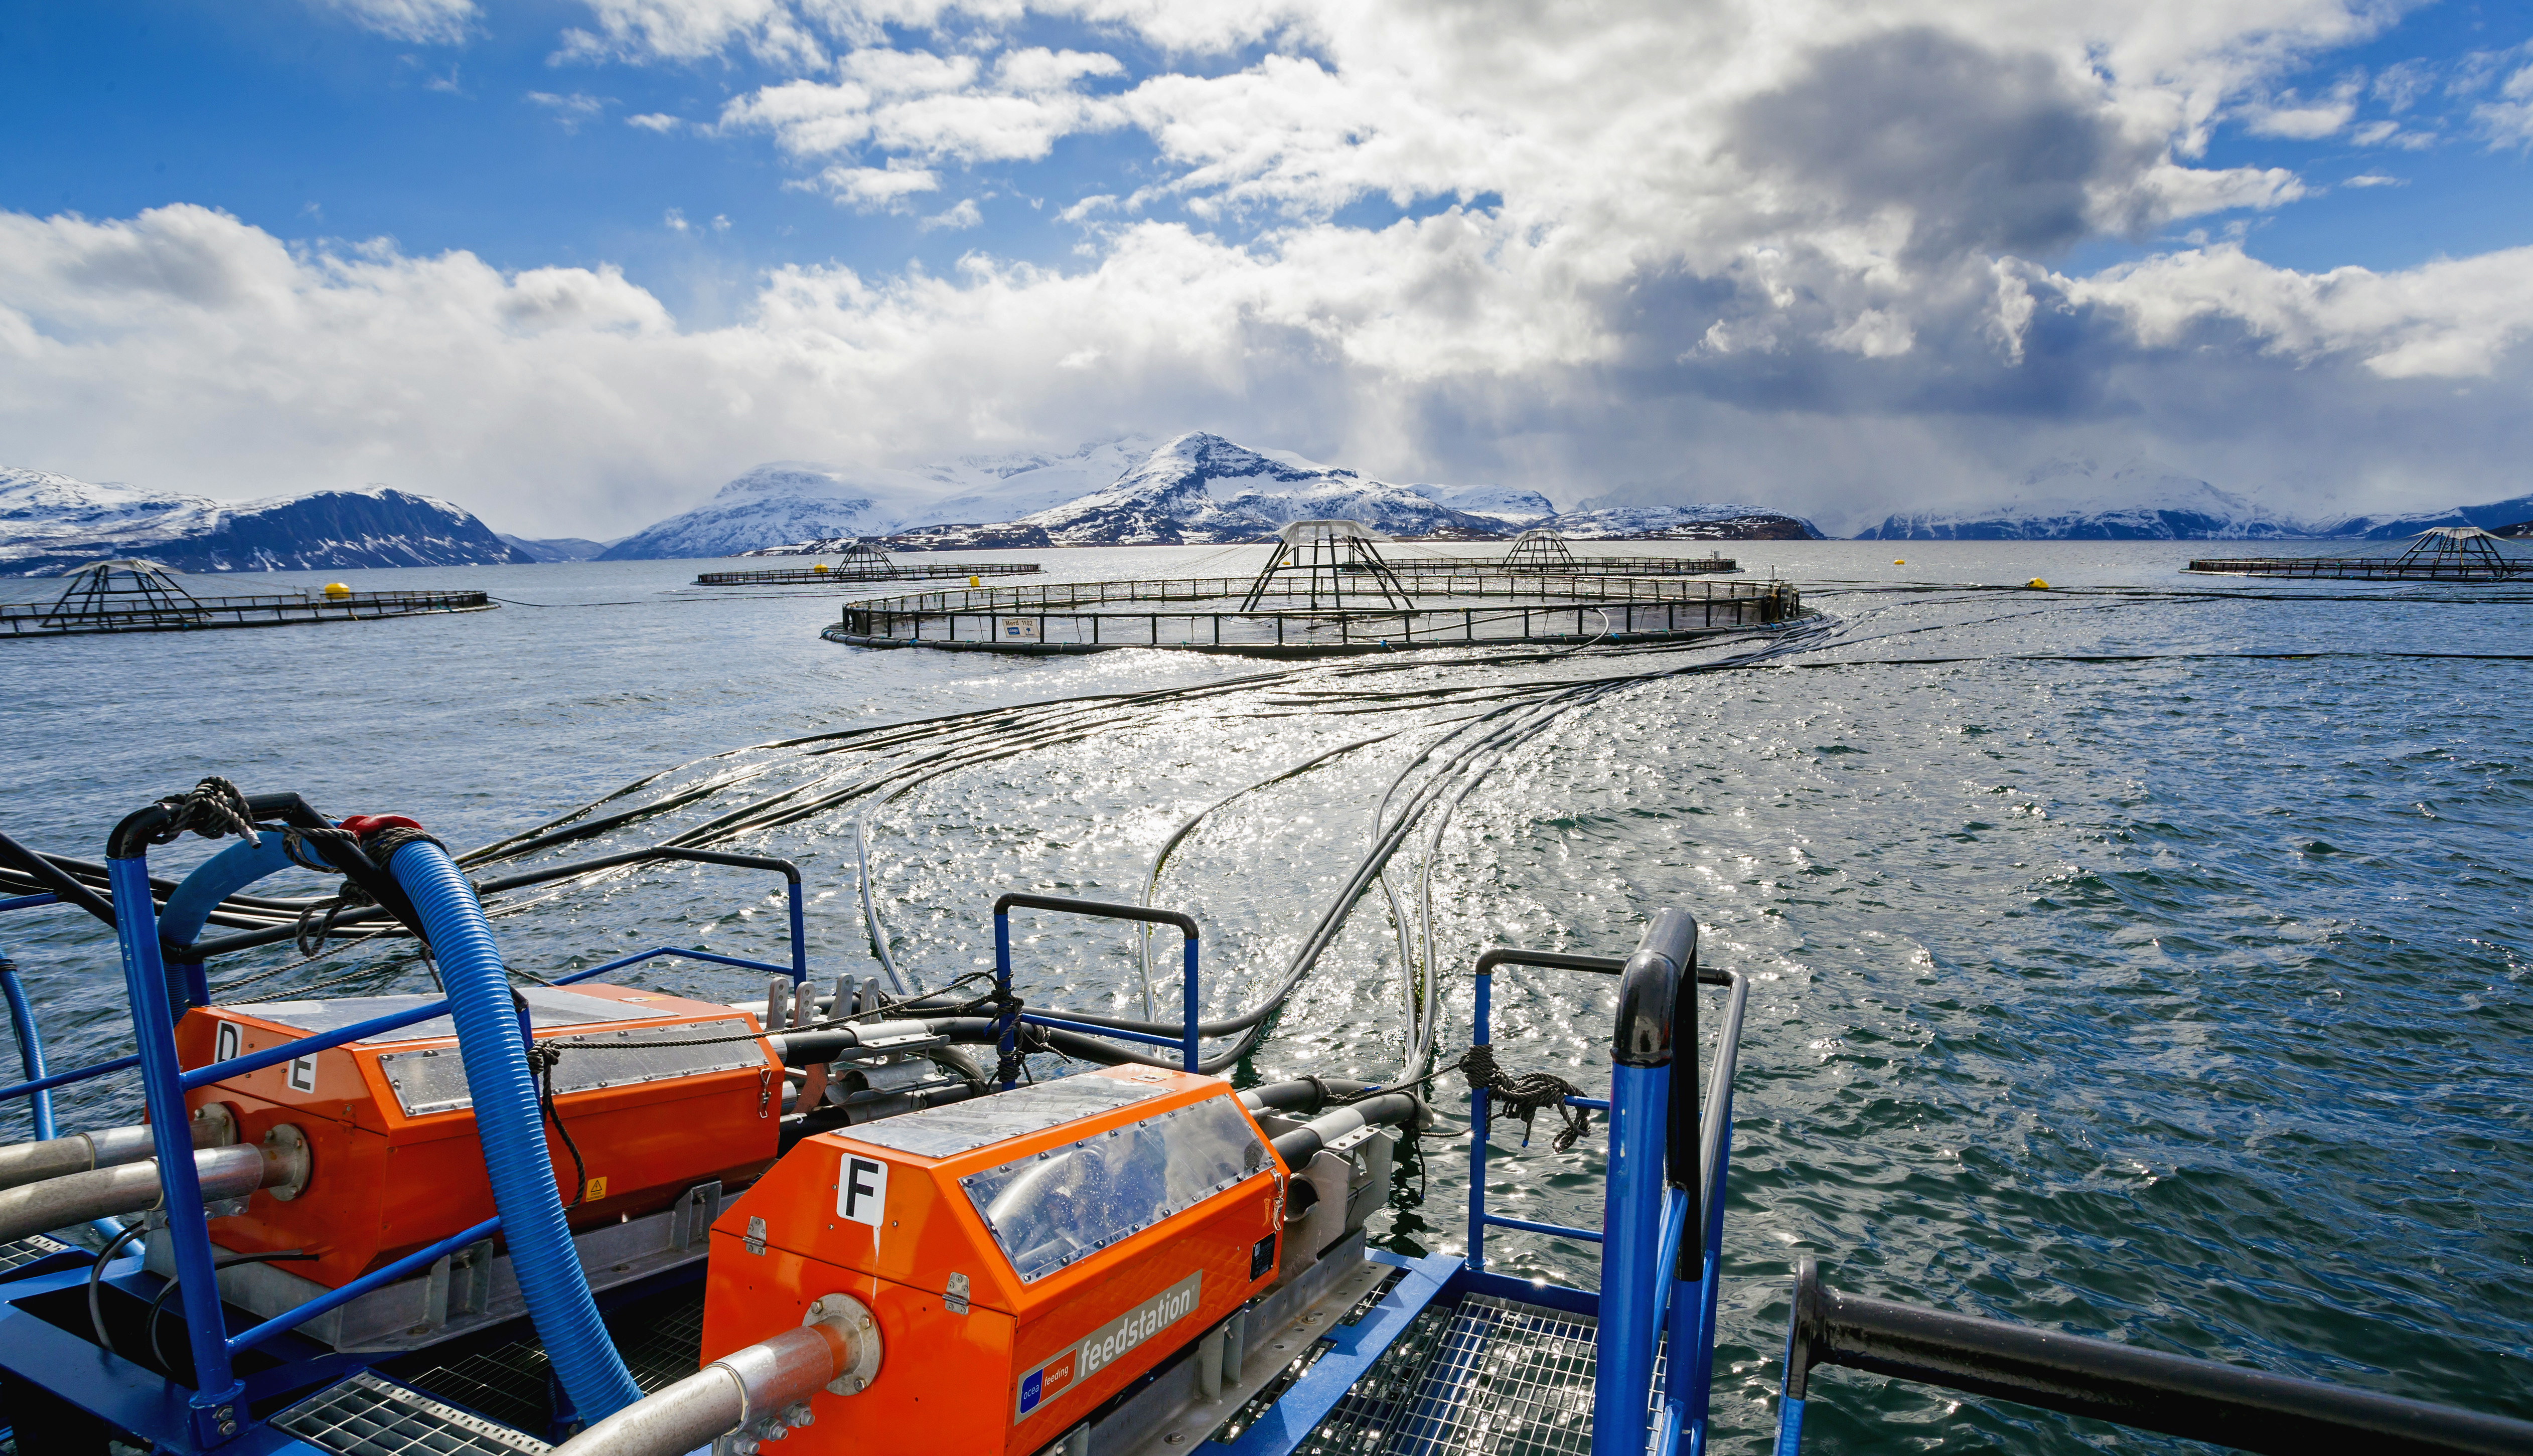
The Group has established a range of measures to reduce its environmental impact; from obtaining power from land, hybrid fleets, floating solar cells, to electric working boats.
Where possible, the Group prioritises electricity sourced from onshore power grids instead of relying on generators at each production site. The use of shore power typically provides both environmental and economic benefits.
Using shore power results in:
- Reduced greenhouse gas emissions
- Lower noise levels
- Cost efficiency
- Reduced maintenance needs
More than 80% of the Group’s sites are now powered by shore-based electricity. At sites where the necessary infrastructure is not yet in place, Lerøy Seafood Group is developing hybrid solutions that can improve the efficiency of fossil fuel use by up to 30%.
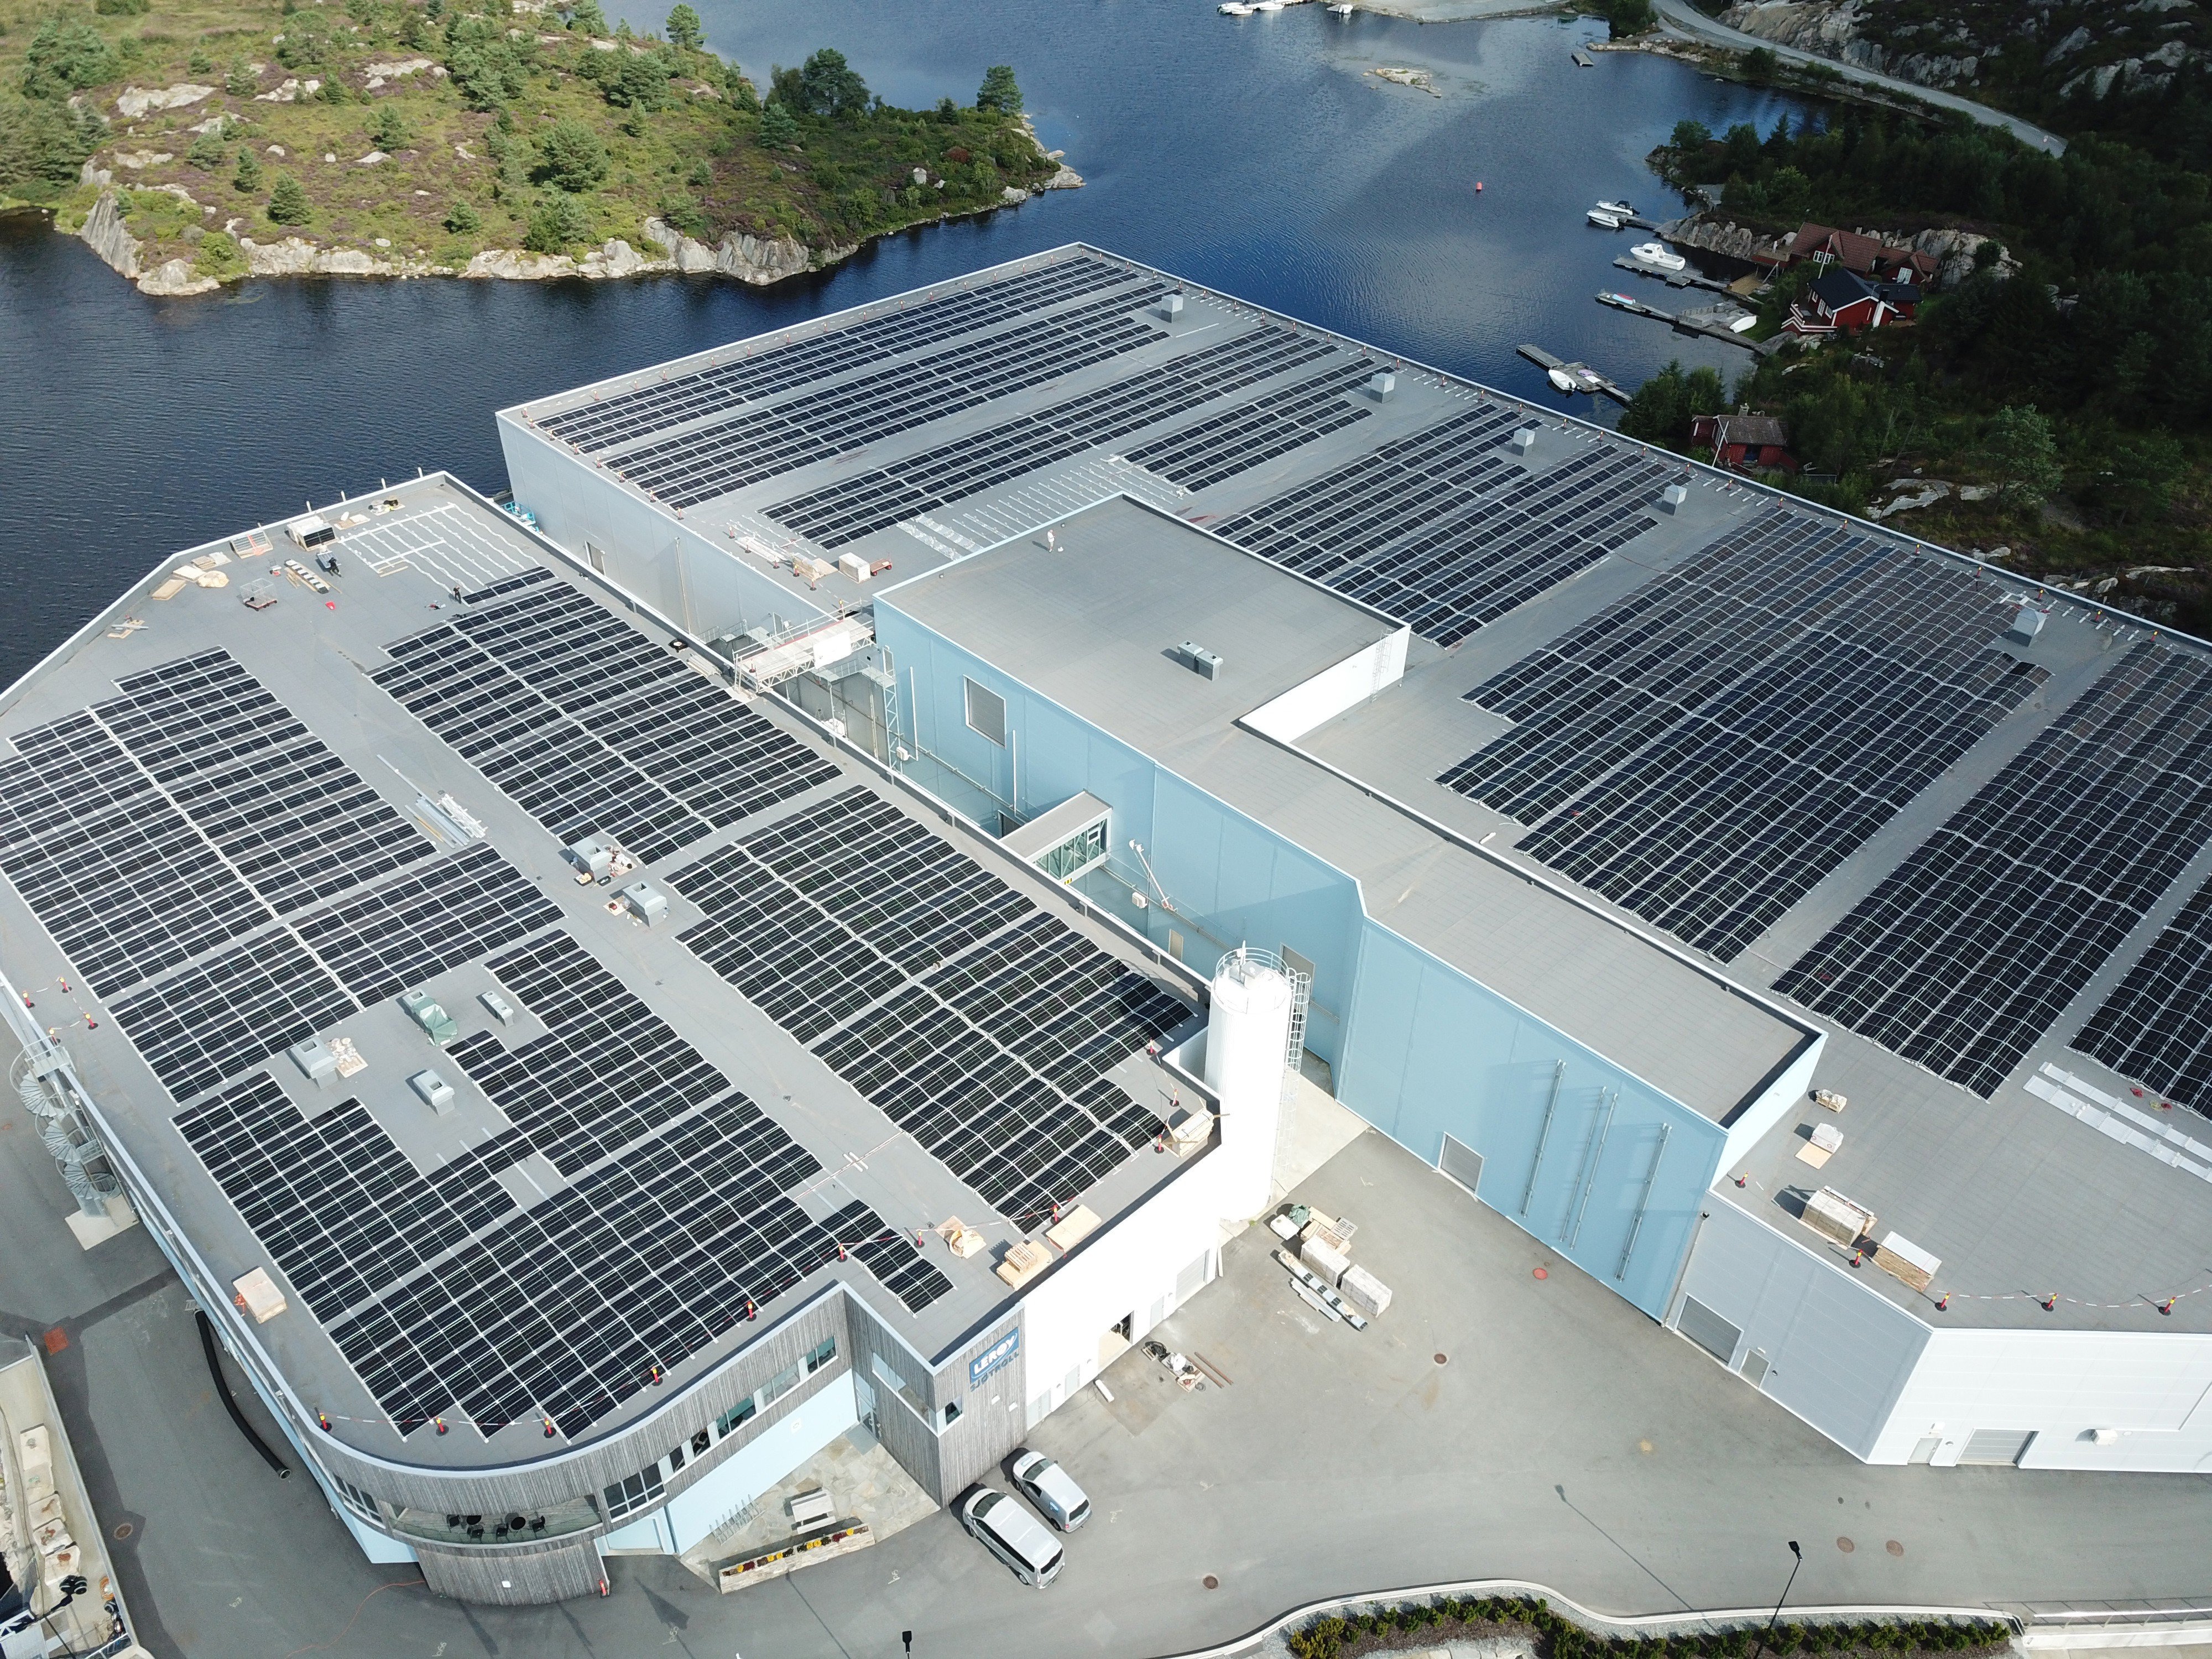
Lerøy Kjærelva operates as a RAS (Recirculating Aquaculture Systems) facility, reusing 99% of its water. This minimal water usage makes it environmentally friendly and sustainable. However, RAS technology demands more electricity for water purification, resulting in a higher energy footprint for fish from RAS facilities compared to traditional farming. Nonetheless, the use of solar panels helps lower the overall carbon footprint of the facility.