The Group keeps a focus on eco-friendly solutions and works on keeping both direct and indirect emissions as low as possible.
The framework selected for calculating CO2 emissions includes emissions from combustion processes required for the Group’s operations. This is referred to below as direct emissions, Scope 1.
The Group also wanted to gain an overview of the indirect impact on global warming of the company's activities and has therefore also included CO2 emissions from the production of electricity consumed by the Group. This is referred to below as indirect emissions, Scope 2.
All sources of greenhouse gas emissions from the Group's core activities have been included in the calculations.
The purchase of products and services, scope 3 is calculated for 2019 but not for 2020.
The group had a goal for 2020 to map scope 3 for 2019 in order to set Science Based Targets by 2030. This was implemented and we are pleased to announce that we have now had our science based targets approved by The Steering Committee of The Science Based Targets initiative.
By introducing SBT, The Group has set a clear course for climate reduction throughout the entire value chain. Both the company's board, group management and employees are behind the goals that have been set and we will work well together through "One Lerøy" to ensure that we will achieve the goals that have been set.
Main goal:
“Lerøy Seafood Group ASA commits to reduce absolute scope 1, 2 and 3 GHG emissions 46% by 2030 from a 2019 base year.”
The target is aligned with a 1,5 degrees C pathway.

Greenhouse gas emissions
The tables provide a summary of consumption of fossil fuels and electricity, and greenhouse gas emissions per segment and in total.
Total Consumption of fossile fuels (Scope 1)
| Unit | 2017 | 2018 | 2019 | 2020 | |
| Farming | |||||
| Diesel | liters | 2 152 314 | 2 231 538 | 2 609 865 | 2 639 377 |
| Marine gas oil (MGO) | liters | 3 873 248 | 3 540 847 | 3 656 064 | 3 549 989 |
| Petrol | liters | 223 333 | 189 285 | 264 596 | 415 777 |
| Biodiesel fuel (HVO) | liters | 26 200 | - | - | - |
| LPG (Propane) | kg | 58 328 | - | - | - |
| Fuel oil | liters | 21 181 | 26 202 | 84 271 | 206 764 |
| Refrigerants | kg | - | - | 1 921 | 478 |
| Wild catch | |||||
| Diesel | liters | - | 3 192 | 9 782 | 8 589 |
| Marine gas oil (MGO) | liters | 32 359 151 | 36 538 544 | 35 559 152 | 38 723 297 |
| LPG (Propane) | kg | - | - | 203 | 780 |
| LPG (Propane) | liters | 1 136 | |||
| Petrol | liters | 503 | |||
| VAP, Sales and Distribution | |||||
| Diesel | liters | 163 577 | 164 451 | 556 802 | 402 883 |
| Petrol | liters | 22 024 | 25 154 | 24 260 | 28 087 |
| Natural gas | m3 | 2 096 | - | 24 267 | 76 287 |
| LPG (Propane) | kg | - | - | 50 935 | 53 825 |
| LPG (Propane) | liters | - | - | - | 132 |
| Fuel oil | liters | 18 165 | 19 254 | 17 525 | 18 051 |
| Refrigerants | kg | 75 | 74 | - | 96 |
| The Group | |||||
| Diesel | liters | 2 315 891 | 2 399 181 | 3 176 449 | 3 050 849 |
| Marine gas oil (MGO) | liters | 36 232 399 | 40 079 391 | 39 215 216 | 42 273 286 |
| Petrol | liters | 245 357 | 214 439 | 288 856 | 444 367 |
| Biodiesel fuel (HVO) | liters | 26 200 | - | - | - |
| Natural gas | m3 | 2 890 | - | 24 267 | 76 287 |
| LPG (Propane) | kg | 58 328 | - | 51 138 | 54 605 |
| LPG (Propane) | liters | - | - | - | 1 268 |
| Fuel oil | liters | 39 346 | 45 456 | 101 796 | 224 815 |
| Refrigerants | kg | 76 | 74 | 1 921 | 574 |
The data is verified by an independent third party.
Total Consumption of electricity (Scope 2)
| Unit | 2017 | 2018 | 2019 | 2020 | |
| Farming | MWh | 75 828,6 | 82 019,7 | 98 393,0 | 134 180,2 |
| Wild catch | MWh | 42 188,6 | 19 267,5 | 22 620,7 | 25 570,4 |
| VAP, Sales and Distribution | MWh | 15 066,2 | 9 410,7 | 25 370,2 | 29 576,2 |
| The Group | MWh | 135 628,1 | 110 697,9 | 146 383,9 | 189 326,8 |
The data is verified by an independent third party.
Total tonnes of CO2 equivalent (tCO2e)
| Unit | 2017 | 2018 | 2019 | 2020 | |
| Farming | |||||
| Scope 1 | tCO2e | 17 092 | 16 328 | 18 831 | 18 461 |
| Scope 2 | tCO2e | 3 944 | 3 692 | 3 837 | 5 501 |
| Total | tCO2e | 21 036 | 20 020 | 22 668 | 23 962 |
| Wild catch | |||||
| Scope 1 | tCO2e | 88 543 | 101 395 | 98 720 | 107 501 |
| Scope 2 | tCO2e | 2 194 | 867 | 882 | 1 048 |
| Total | tCO2e | 90 737 | 102 263 | 99 603 | 108 549 |
| VAP, Sales and Distribution | |||||
| Scope 1 | tCO2e | 833 | 841 | 1 798 | 1 830 |
| Scope 2 | tCO2e | 1 981 | 2 304 | 2 757 | 3 376 |
| Total | tCO2e | 2 815 | 3 145 | 4 554 | 5 205 |
| The Group | |||||
| Scope 1 | tCO2e | 106 473 | 118 565 | 119 349 | 127 792 |
| Scope 2 | tCO2e | 8 246 | 6 863 | 7 476 | 9 925 |
| Total | tCO2e | 114 719 | 125 427 | 126 825 | 137 717 |
The data is verified by an independent third party.
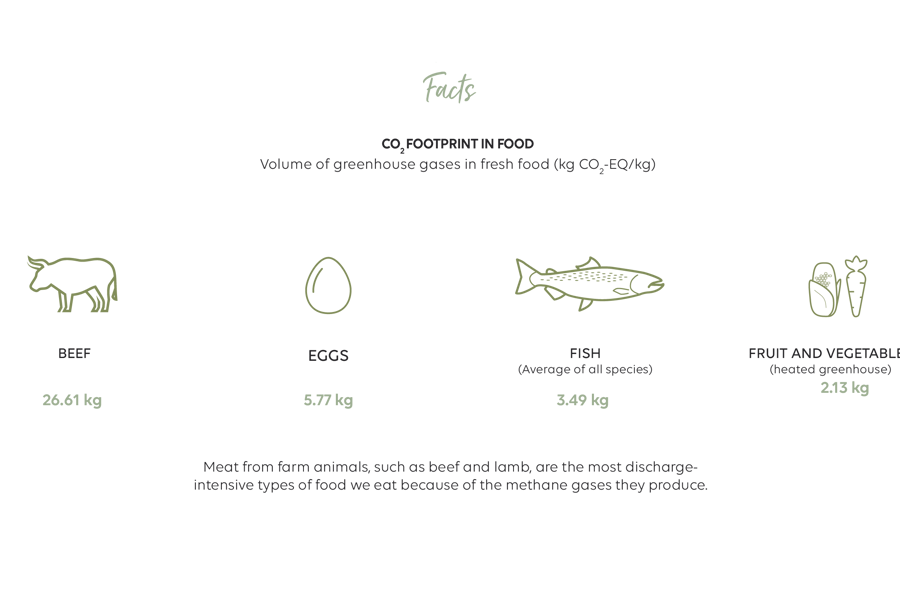
CO2e emissions for fish are in general low. When compared with other types of proteins we eat, salmon has the lowest eco-footprint.
Emissions
Lerøy Seafood Group («Lerøy») is continuously working to improve its Co2e emission monitoring and reporting. Information on emissions is crucial for understanding and responding to environmental pollution. However, we acknowledge that the data quality is not perfect and we strive to improve our data quality and current reported values will be updated if we identify any deviations.
The Group has completed a comprehensive analysis of climate related risks and opportunities to which we believe the Group is exposed over the short, medium and long term. This analysis has confirmed the importance of measuring and reporting environmental performance
Lerøy has set ambitious science based targets to reduce our environmental footprint: We aim to reduce our Co2e emissions by 46% by 2030 compared to 2019 levels. (ref: Climate Policy). Lerøy has defined 2019 as the base year for our science-based climate target as this was the first year all operating segments in the Group were included in the emission reporting. The Group’s operating segments comprise the following: 1) Wild Catch 2 ) Farming and 3) Value Added Processing which also includes sales and distribution.
Our emissions are reported according to the GHG Protocol Corporate Accounting and Reporting Standard.
The GHG Protocol Corporate Standard requires reporting a minimum of scope 1 and scope 2 emissions and you will find this in our updated 2020 emission report. This means that our 2020 report is based on operational control and includes only activities which Lerøy controls. We aim to include emissions data from relevant scope 3 activities in 2021.
The reported emission figures have been collected throughout 2020 from relevant suppliers via invoices and direct monitoring, and are based on the same data source as the figures reported in Lerøy’s 2019 annual report.
The reported figures provide the best estimates at the end of the reporting period and any amendments will be implemented in our annual report for 2021.
Emissions data covers reporting of the following greenhouse gases: carbon dioxide (CO2), methane (CH4), nitrous oxide (N2O), hydrofluorocarbons (HFCs) and perfluorocarbons (PFCs). The Group has not been contributing to any biogenic Co2 emissions in 2020.
For more details regarding methods for calculating Scope 1 and Scope 2 as well as conversion factors, please, contact Head of ESG and Quality, Anne Hilde Midttveit.
WHAT CAUSES OUR EMISSIONS (2019)
The three most important options to decrease our emissions:
